

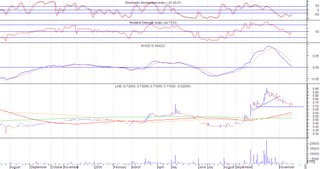
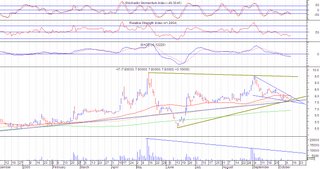
JFC ( Chart: Daily Resistance: 41/42.50 Support: 39)
JFC was initially forming an ascending triangle last November, but this was invalidated when the price gapped down. But the price later bounced with good volume. Considering that the bounce was accompanied by good volume, lots of traders are holding this stock at 39.50-41.50 level, which now provides a good level of support. The downward move during the last 3 days of trading were not significant compared to the volume on the upward move from the 39.50 level. For the coming week, there is a big possibility that price would move sideward or down (to 39.50) for a short time and then would push up to resistance level of 41-42.50. Recommendation: Range Trade. Buy if incase the price moves down near the support level (39-40) and volume is not substantial (below 600T trades). Sell if incase support level at 39 is breached with substantial volume (1M trades) or if resistance level of 42 is reached without substantial volume. FLI ( Chart: Daily Resistance: 1.90 Support: 1.82/ 1.74)
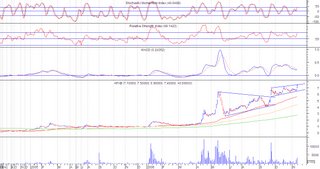
FLIis has reached 1.90 level, the previous high last May bull run. It re-tested the previous high but was unable to break the resistance. For the coming week, FLI may move sidewards to down before trying to re-test the resistance at 1.90. If resistance is broken, there is a possibility that price may reach beyond 2.0 level. Recommendation: Wait, price may still go down below the support at 1.82. Any move below 1.82 support with less volume is a buy. Sell at 1.90 if move upward is not supported with volume. If move upward is supported with good volume, hold till it reaches 2.0 or beyond, then sell. AT ( Chart: Daily Resistance: 9.80/10 Support: 8.80)
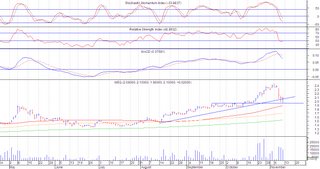
Watch out for AT, probably forming a flag/pennant. Recommendation: Wait for the pullback probably near 9.50 level. Pullback should have diminishing volume. APX ( Chart:Daily Resistance: 6.20 Support: 6.0)
APX and APXB is poised for a bounce from the support. Recommendation: Buy at 6-6.50 level. Observe the volume, APX exhibited unusual volume last Friday, but the same did not happen for APXB, but nonetheless, do observe if the bounce is accompanied by good volume (greater than 4M trades)
Search Google

Sunday, December 17, 2006
StockWatch (Dec 18-22) JFC, FLI, AT, APX/APXB
In Retrospect : BPC, ABS, ABSP, PLTL
BPC
On last analysis, an island reversal formed but this was invalidated by a large volume by Dec 7 which propelled price way beyond resistance and gapped up twice. Price is currently consolidating, probably for another push upward.
ABS/ABSP
PLTL
Sunday, December 03, 2006
StockWatch (Dec 4-8, 2006) BPC, ABS/ABSP, PLTL
 BPC (Chart: Daily Resistance: 1.92/1.80 Support: 1.70)
This stock formed an island reversal. Price is bound for another short move upward, but may fail to break the resistance. Recommendation: Sell near resistance
 ABS/ABSP (Chart: Daily Resistance: 23 Support: 19/18.50)
 PLTL ( Chart: Daily Resistance: 6.20/6.10 Support: 5.90)
In Retrospect: MEG, JFC, VUL, WPI
Checking on the previous week’s analysis
MEG
The price went down as low as 1.96 and rallied up again for two days. The descending triangle that is in its early formation is invalidated by the increase in volume during the Nov 28 downward movement. This downward movement further established a new support. Currently MEG is still a stock to avoid as the MACD is still in a bearish stance. If the price at 2.30 is not broken and instead a new lower peak is formed, it is a further confirmation of the bearish move.
JFC
The Nov 28 downward movement invalidated the ascending triangle being formed. But this downward movement established a support level at 39. Interestingly, the upward movement on the last day of trading during last week was accompanied by high volume, which increases the holders at 39-40 level, providing a strong support in those levels. Though MACD is still bearish, I believe that because of the increase in volume prices may start to move up, possibly trying to re-test the resistance at 42.
VUL
The pole formed for two successive trading days was followed by a flag formation, but was unsuccessful at breaking the resistance. Further correction may still follow as stock is already overbought.
WPI
The ascending triangle formation failed and broke the support. The MACD is now in a bearish stance.
Sunday, November 26, 2006
StockWatch (Nov 27-30, 2006): MEG, JFC, VUL, WPI


JFC (Chart: Daily Resistance: 42.50 Support 40.50)
 VUL( Chart: Daily Resistance: 0.98 Support: 0.83)
 VUL is a possible candidate for a Pennant/Flag formation. The pole is already establish, just waiting for the flag/penant

WPI (Chart: Daily Resistance: 0.68 Support: 0.59)
In Retrospect: MERB, LND, GSMI
Checking on the previous week’s analysis
MERB
MERB topped out at 37 and headed to the 35 level. Expect further move downward possibly towards 33 level. Any further move beyond 32 may be an indication of further downward to sideward movement.
LND
LND broke the support and moved further below 0.7. Volume is still not that great so a lot are still holding on to their stock. Next support is 0.55, previous low or 0.62 the 65 day MA.
GSMI
GSMI made another gap down with high volume. Tried to move to higher price levels (21.75) , but was not accompanied by volume so it dropped the next day. There is still a big possibility of price moving below 20
Monday, November 20, 2006
Stock Spotlight: An Electrifying Future for MERB
MERB Weekly Chart

The recent movement of MERB has been very bullish that it had me looking at the past as to whether this bullishness is somehow part of what kind of trend. As taught to me by the masters of absolute trading, there are only 3 ways where the stock would go, either up, down or sideways. Looking at MERB’s chart from 1992, it somehow surprised me that there really is something brewing for this stock. The downward trend from 1997 has been broken by 2003 and from then on, the stock has now started to slowly move sideways to up. A higher low has been established last May 2006 which suggest that the recent bullishness might be part of an upward trend. One thing left to confirm this upward trend is for the stock to break the 2004 resistance of 37.50 which is P0.50 away from last Friday’s price movement.
It is interesting to note that the price movement from 2003 up to current seems to be forming an ascending triangle. If the resistance at 37.50 is not broken, and the price starts to move down, this might be a confirmation of the ascending triangle, that it is still consolidating and it may take a year or two before the resistance is re-tested.
Its a wait and see for the 37.50 resistance will be broken.
StockWatch (Nov 20-24, 2006) MERB, LND, GSMI

MERB has broken an ascending triangle with volume, but not enough to characterize a good breakout. A pennant has also been formed, broken with very good volume and reached its target price. The things to look out for are the following: A. Another pennant formation. If this happens, then 37.50 resistance (previous high of 2004) can be easily broken. B. Downward movement if 37.50 is not broken. We could see a downward movement if 37.50 has not been successfully broken. Hopefully, it would just be a move towards the 35/33/31 support level. Any move further downward might result into a year long consolidation between 37.50 and 20.
Interesting to note: The downward price movement is not accompanied by volume, which suggests that people are still holding on to the stock at 0.8-0.9 level. Currently price is now at 0.7 level and based on SMI we might see an upward move for this stock again.

This is one stock to avoid, for now. GSMI gapped down with volume, which is a very very bearish event. Probably wait for the price to go down to 18-19 level before going in.
Sunday, November 12, 2006
StockWatch (Nov 13-17, 2006) Mining Index, LCB, APXB, PX, MEG, JGS

Just something to note: The mining index registered an unusual increase in volume last Friday. The index gapped up with high volume, which indicates that traders have started coming in. We may see mining stocks having their day in this bullish market.

LCB picked up in volume lately. No pattern has emerged, except for an upward channel. But with the pickup in volume, and the mining index picking up, we could hope that LCB would ride with the wave towards the long term resistance at 0.45 level.
 APXB ( Chart: Daily Resistance: 7.50 Support: 6.50)
Interesting to note: APXB gapped up with volume. High possibility of upward movement to break the resistance as MACD positioning to cross above the signal line. Although RSI might be oversold, seeing previous RSI levels may indicate that a move beyond the oversold level is a possibility. Hopefully APXB (and APX) could also ride the mining wave.
 PX ( Chart: Daily Resistance: 5.00/5.50 Support: 4.30/4.00)
Interesting to note: PX gapped up and broke out from a short term resistance line of 4.30. The increase in volume hopefully would bring the price up to its previous high of 5.90
 MEG( Chart: Daily Resistance: 2.44 Support: 1.96)
MEG has had a bearish move recently. MACD crossed below the signal line accompanied with volume. No pattern has emerged yet, but what MEG needs is additional volume in its upward move for it to reach the previous high. If more volume does not come in, we could see a side to downward move. For now, a bounce from the support might be forthcoming.

JGS ( Chart : Daily Resistance: 8.10 Support: 7.90/7.40)
JGS has formed a rounding bottom pattern, with the characteristics of high volume activity on the sides of the pattern. But recent price movements have somehow started to invalidate the pattern as no high volume came to break the resistance and the price continued its sideward movement. RSI is currently oversold and MACD has crossed below signal line, which might indicate an up coming move downwards. For now it would be best to take profit and possibly pick it up later.
Sunday, November 05, 2006
StockWatch (Nov 6-10, 2006) SMPH, JGS, PCOR, BPC
SMPH
SMPH reached its ascending triangle target of 9.50.
JGS (Chart: Daily Resistance: 8.10 Support: 7.90-7.40)
JGS has reached last May’s previous high of 8.10 and it is now testing that resistance. It is a wait and see if the resistance will be broken by the bulls. If it is broken with volume, we may see a move towards P9-10 level. A short term down movement may happen as the stock is on the oversold level and MACD is positioning to cross down the signal line.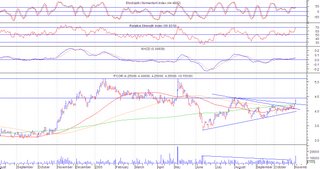
PCOR (Chart: Daily Resistance: 4.45 Support: 4.20)
The support held after the breakout and last Friday we saw the volume pick up to 13M shares traded. The price also went above the 260 day MA. Previous high last July is now the current resistance at 4.45. Target price for this breakout is 5.10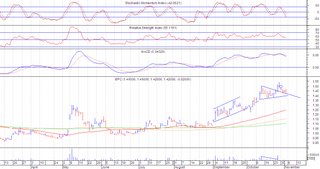
BPC (Chart: Daily Resistance: 1.46/1.54 Support: 1.42)
After breaking out of a small symmetrical triangle, it has started to retest the previous resistance line, which is now the support. A gap down can be noticed 2 days after the break out. If the support holds, we may see a move back up to 1.54. If the support is broken, next level of support is 1.38. But the high volume at breakout gives a higher possibility that the support would hold and the gap down be covered.
Sunday, October 29, 2006
StockWatch (Oct 30-Nov 3, 2006) MERB, PCOR, PLTL, PX

MERB (Chart: Daily Resistance: 33 Support: 30 )
The stock is forming an ascending triangle with resistance at 33 and a possible upside of P5. But currently it is also trading within an upward channel. At this point, the ascending triangle is still in its early formation and the volume is not yet confirming the formation. If the ascending triangle is invalidated, we may just see a continuation of the upward channel with resistance at 34.
PCOR (Chart: Daily Resistance: 4.20 Support: 4.10)
PCOR has already broken out of the symmetrical triangle, the breakout volume was sufficient enough but not convincing, and the 260-day MA is currently blocking the price from going up. PCOR needs a little more push. Hopefully more volume would kick in the following days and that the support would hold.
PLTL
Previously I was expecting this stock to go down anytime, but it looks like traders are bullish with this stock and kept on buying it up to 5.30. As of current, MACD has turned from bad to good. Maybe we could expect more from this stock, but we don’t know up until when this upward trend will last. Better keep an eye on the MACD.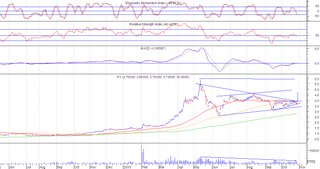
PX( Chart: Daily Resistance: 3.95/4.0 Support: 3.70/3.40)
The small ascending triangle previously noted is still intact. Hopefully the support holds
Sunday, October 22, 2006
StockWatch (Oct 23-26, 2006) PSEi, PCOR, FLI, PLTL, PX, AT
 PSEi
PSEi
It is just interesting to note that as of last Friday, the PSEi has already gone past the previous high since last May’s Bull Run. Some stocks are also exhibiting signs of reaching their previous highs last May.
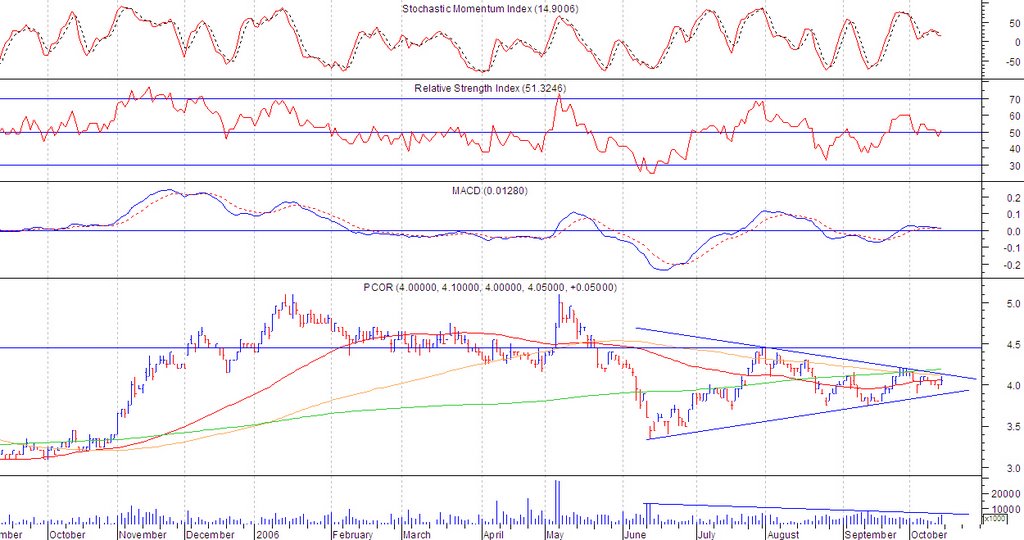
 PCOR(Chart: Daily Resistance: 4.10 Support: 3.90)
The symmetrical triangle is still intact. Price is now nearing resistance and currently the 65 day MA is providing support. Again, hopefully the pattern stays intact within the week and the price breaks the resistance. Otherwise if the consolidation is prolonged, the pattern may be invalidated

FLI ( Chart: Daily Resistance: 1.70 Support: 1.60)
FLI is forming a small ascending triangle. Though the possible upside from the pattern is small (just 0.10), it may be an indication that it might be able to reach the previous high of 1.90 last May

PLTL (Chart: Daily Resistance: 5.00 Support: 4.80)
PLTL’s previous rising wedge pattern has been invalidated by the new highs last Monday and Tuesday. From a rising wedge, it has now transformed into an upward channel. But, even if it has changed pattern, the MACD is still in a bearish stance and the higher highs generated by the previous trading days has created a confirmation of the divergence of price from the RSI and MACD
PX seems to be forming a big symmetrical triangle or just an upward channel. From within that big pattern, you can also see a small ascending triangle extending from Sept to Oct with resistance at 3.95. If the small ascending triangle is broken with volume, probably above 15M shares traded, it would have an upside target of 4.75.

AT (Chart: Daily Resistance: 8.50 Support: 8.20)
AT’s falling wedge has been broken in the last 2 days trading of the previous week. The volume on the breakout point is significant, but I think it is lacking. I was looking forward to a volume of above 3M shares traded for the break out point, but it did not materialize. The lacking volume on the breakout point was further confirmed by a low volume on the next trading day. From 2M, volume went down to 200T shares. With this kind of lethargic volume, I am inclined to think that the current price may test the support. Hopefully, if the support is tested and the price succeeds to remain above support and MA line, volume would come in to propel the price to the 9.50 possible target. As of current, I don’t think that would be achieved if the volume does not pickup.
Sunday, October 15, 2006
StockWatch (Oct 16-20, 2006) PCOR, PLTL, AT
PCOR (Chart: Daily Resistance: 4.10 Support: 3.90)
PCOR’s symmetrical triangle formation is still intact. If the resistance is broken, we can expect a target price of 5.10, which is also the previous high last May. But since this is a symmetrical triangle, there is also a possibility of break down. Cut loss immediately if 3.90 is broken.

PLTL (Chart: Daily Resistance: 4.90 Support: 4.60)
Looks like PLTL is showing some bearish characteristics and may indicate that the upward trend may be nearing its end. First obvious sign is the rising wedge. A rising wedge is generally a bearish pattern, and if found at an upward trend, indicates the upward trend to be nearing its end. Second sign is the MACD crossing below signal line. Take profit on rally.
AT (Chart: Daily Resistance: 7.90 Support: 7.70/7.60/7.50)
AT is currently re-testing the support line from June 2005. This stock has previously broken that support line but was able to recover during the middle of June 2006. But before the 2005 support line is challenged, it has to challenge a couple of support levels: the 130 day MA and the support line from a big triangle (green), both converging at the 7.70 price level. Im guessing (just a guess) that price may move further down to 7.60, the 2005 support line. What I am hopeful about is the currently forming falling wedge, which if the price breaks out from, may see a potential upward movement to 9.50.
Monday, October 09, 2006
Stock Watch (Oct 9-13, 2006) PCOR
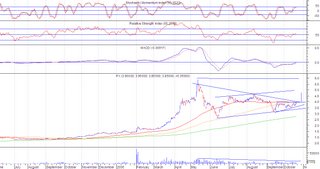
 PCOR (Chart: Daily Resistance: 4.16 Support: 3.85)
PCOR is forming a symmetrical triangle. I earlier commented that this stock has a negative outlook as the sell down from Sept 5-14 was accompanied by substantial volume, the MACD was below zero line and signal line. But currently, volume is also substantial in the upward movement and the MACD has crossed above zero line which now implies a positive outlook. The recent increase in trading volume suggests that this stock has caught the attention of some traders. If resistance is broken with volume, a possibility of near 1 peso increase in price.
Monday, September 25, 2006
StockWatch(Sept 25-26, 2006) PHISIX, PCP, APXB

PHISIX
Currently within a pennant formation, if the pennant is broken , upside is 2700

PCP
PCP is in a pennant formation. Resistance is at 0.17, support is at 0.15. Target price is 0.23. Sell immediately if it goes below support.
APXB
Already broke out of triangle. Waiting for a pullback at around 6 to get in
Saturday, September 16, 2006
StockWatch (Sept 18-22,2006) ALI, SMPH, MAB

MAB
A possible symmetrical triangle is emerging from MAB. But at this point, im not so sure if the volume confirms it.

SMPH
The ascending triangle is still intact with resistance at 8.20. Im expecting that this may reach 8.10-8.20 before pulling back to near support of 7.80-7.90

ALI
The ascending triangle is still intact. If it is still unable to break resistance at 14.25, this would be a confirmation that it is now on a sideways movement with a range of 13 -14.25
Sunday, September 10, 2006
StockWatch (Sept 11-15, 2006) SMPH, PCOR, PLTL, MBT, ALI

SMPH
Price is still within the ascending triangle. Hopefully the support at 7.70 holds to keep the ascending triangle intact. 
PCOR
I earlier said that PCOR is an ascending triangle. On further analysis, I was wrong in assuming that it is an ascending triangle. After this week’s activity, it seems to be forming more as a symmetrical triangle, with support at 3.8 and resistance at 40.50. Considering the volume increase towards the tip of the triangle, I’m now in doubt if this is a valid symmetrical triangle. I am more inclined to consider this as a bearish move that may break the support.

PLTL
PLTL has broken out of the symmetrical triangle, but has yet to meet its target price of 4.75 because it has met a resistance at the 4.35 level. From the 4.35 level it moved back 38.2%. If the price is able to hold at the 4.10 level, we may still see a further upward move to its target price of 4.75. If not, we may see a move towards the 3.8 level the previous resistance which is now a support level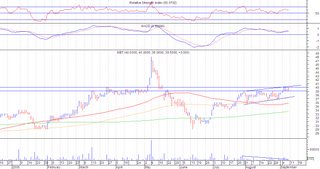
MBT
I was expecting a breakout of price from the ascending triangle formation, but apparently, the break above the 39 level resistance came without a convincing volume. The succeeding days further confirmed the false breakout. It now seems to be further consolidating into an upward channel. The immediate support is at 39 and resistance is at 40.50.

ALI
The recent price movement of ALI seems to confirm the resistance at 14.25. But after further analyzing, there are several patterns that seem to be forming. There are 2 ascending triangle forming. The first is a big ascending triangle with a target at around 17 and the second is a small ascending triangle, with a target at around 16. The third is a sideward channel. But I think the smaller ascending triangle and the horizontal channel are much more valid than the bigger ascending triangle. If the resistance is broken without volume, im expecting a slow push towards the 15 level. If it does reach that level, we may be looking at a big ascending triangle.
Tuesday, September 05, 2006
Steve Irwin passed away Sept 4, 2006
 Just heard a bad news, the Croc hunter Steve Irwin recently died while shooting a film in the Great Barrier Reef. A Stingray punctured his chest hitting his heart directly, the other bad thing about it is that the Stingray’s tail excrete poisonous fluid. It was a double whammy for Steve, heart puncture with a poison. I always thought he’d have an accident with a croc or a snake, never thought that a stingray would get him.


