
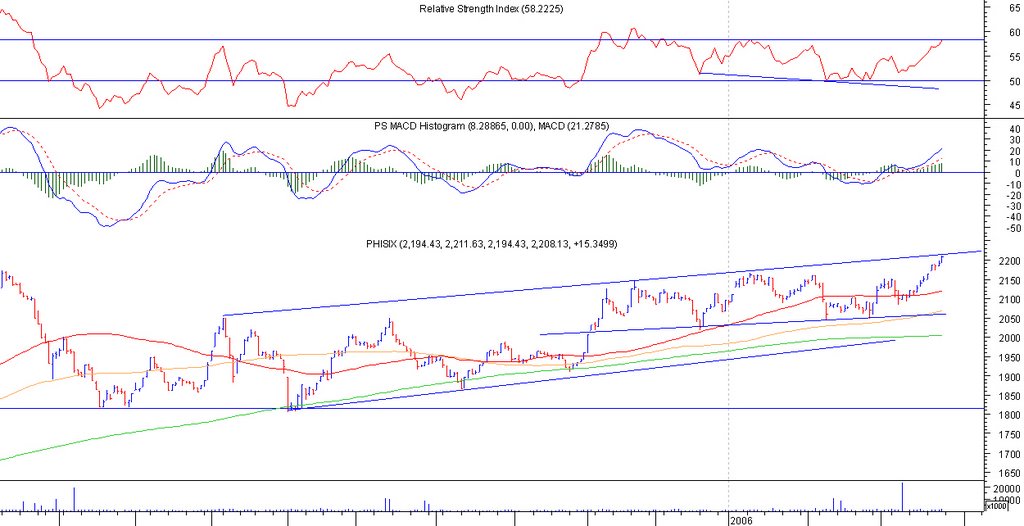
 PHISIX(Chart:Daily ** Support: 2170-2160**Resistance: 2,215)
Looks like PHISIX will try to correct by this week. We’ve had a unceasing run up for 2 weeks, and a lot of stocks has broken above their resistance lines. We may see the Phisix correct down to 2170-2160 as profit taking may take place next week. It is interesting to note that 2170 was last years high and we have already broken above it. Overall Phisix is still bullish, but a correction is due.
PCOR (Chart:Daily**Support: 4.40 ** Resistance: 4.60)
PCOR was one of the disappointments for last week. I was expecting this to take off but instead it pulled back. But not to despair there is still a future for this stock. I think we have a strong support at 4.40 as this has been the support since late Feb and as indicated by the RSI, which is about to reach the low of the month so I expect strong buying at that level. The level would be good price level to enter if you’re betting on range trading. The upward battle might be hard; we have the 65-day MA blocking the way at 4.60 and MACD is not looking good. If 4.40 do prove to be a strong support once again, the break above the 65-day MA is still a possibility. My bet, 4.40 would hold as support and by near the end of the week it may cross above the 65-day MA. 
MBT (Chart:Daily ** Support: 38/36** Resistance: 40/40.50)
Looks like MBT had a very good bull run for 2 months! That was amazing! But the alarm needs to be blown at this point. I see that the stock is now near the previous year’s resistance also during the same time period Feb-Mar. Is this a perfect example of “History repeats itself”? The MACD still looks good, but the RSI is indicating an oversold level. I couldn’t trust the MACD at this point because the previous year’s high also had a good looking MACD, but it started to dip after reaching the high. My bet is that this stock will still try to kick upward in maybe its last attempt to cash in. Then after that we may see a downward move near an immediate support of 36. A couple of disturbing patterns here, we have a rising wedge, which may dictate a price pull down to the 32 level and if it would pull down to that level, looks like were seeing a double top. Both are very bearish indicators. So take caution on this stock.
Search Google

Saturday, March 25, 2006
StockWatch(Mar 27 – 31, 2006) PHISIX, PCOR, MBT
Inretrospect (Mar 19-24 2006) JGS, SMPH, MWC
JGS
Whoa!!! And the ball is out of this field!!! This stock turned mad bull and charged its way up unceasingly. In my last week’s analysis, the target price that I set was at 6.10, and last Friday it did reach our target price. Lucky are those who were able to ride the bull. Mang libre naman kayo! =p. You’d ask when would the upward movement end? Well ofcourse no one knows! Just practice your discipline and get out of that stock, coz it has already reached its target price. It may still kick up some fluctuations by Monday, but I wouldn’t bet a 100% on that as RSI is nearing oversold level. The stock is good for long hold, but ofcourse being a tsupitero, it is best to sell now, then buy later at a lower price when the price of the stock pulls back, then hold it if your really going for long.
SMPH
In my analysis last week, I’ve said that this week would be SMPH’s week, but I guess I was expecting a lot from this stock. I was expecting it to fly, but it did not, what happened was there was a lot of accumulation at 7.90. and it has for the whole week, tried to cross below the 65 day MA. MACD is now positioning itself to cross down, and its weekly and monthly MACD does not confirm a bullish trend that I was expecting. Looks like 8.0 has proven itself to be a strong resistance while 7.90 looks also like a strong support. Will it go down? Im not sure, but if next week is still characterized by accumulation at 7.90 level, we may still have a chance of breaking the 8.0 –8.10 level. If the support at 7.80 – 7.90 does not hold, we could expect price move down to 7.60
MWC
Nothing new here, as from my previous analysis, I was expecting accumulation at 6.40 and there was accumulation at that level. The only thing new was the 130-day MA catching up with the 6.40 support. MACD has now crossed below signal line, sign of things to come? My bet is that it would still be able to maintain the 6.40 support
Saturday, March 18, 2006
StockWatch (March 17, 2006)
 JGS (Chart:Daily**Support:4.90**Resistance:5.20)
 This stock is very promising. When I got to look at this chart’s “story”(as what my TA lecturer had said, you have to look at the chart’s story to better understand it), it was a story of an immediate fad, a falling star, a flat liner and now…. it looks like it’s redeeming itself back. The stock slowly started its revival from flat lines last year, 2005, with a spiky behavior. For this year it looks like a time for the revival of its 1993 glory. Since the start of this year, the stock has been very bullish for many reasons: 1) the stock was able to break above the 3 MA’s. 2) MACD has since been moving above the zero line 3) even if the MACD’s daily chart has crossed below signal line, the MACD for weekly and monthly says otherwise, so the cross below the signal line looks like it is temporary. Another good thing about this stock is that it looks like it is now forming an ascending triangle and currently testing the support level of the upward channel. If and when the support holds, we can expect a price movement up to the 5.20 level and maybe a breakout at that level. If a break out at that level occurs, our price target is 6.10, buy at 5.30 and cut loss at 5.10. For now lets wait for that break out to occur.

SMPH(Chart:Daily**Support: 7.90 **Resistance: 8.10)
Need I say more of this stock? All we are waiting for is a good breakout of the symmetrical triangle at 8.10. We need a very good volume at 8.10 for the breakout to occur. Last Thursday and Friday’s trading had insufficient volume at the breakout level, so the expected breakout has not yet occurred. Looks like next week would be SMPH’s week. Our price target is at 9.60, buy at 8.20, and cut loss at 8.0. If the breakout occurs, 9.40 would be a good level to sell if you’d like to be on the safe side.

MWC(Chart: Daily**Support: 6.40 **Resistance: 6.50/6.60)
This stock also looks very enticing. We now have a symmetrical triangle formed with MACD above signal line and above zero line, which is a bullish indicator. In addition to that we also have the price currently above the 2 MA’s. This stock has had a problem breaking above the 2 MA’s previously, so at current level it is a welcome change in behavior. We just hope that the 6.40 support would hold for next week. Expect that next week would be an accumulation phase should the 6.40 support hold. Breakout may occur in the very near future, but there is still a possibility of it trying to pull down to the 6.30 level.
Thursday, March 09, 2006
StockWatch (Mar 8)
 PHISIX (Chart:Daily Support: 2080/2060 Resistance: 2120/2150)
Last week in my analysis, I placed my bet that the index would be trapped inside the 2 moving averages. To everyone’s surprise the index broke out of the 65day MA in spite of the political turmoil that happened. But this week, the index has started to decline, the previous week’s gain has now been lost and it’s just the middle of the week. If the current support level would not hold, we may see the index touch the 2050 level again. As of current, a pattern is starting to emerge; it looks like the previous upward trend is now starting to move sideways, probably consolidating. Couple of observations though, first is that the MACD is in the position to cross downwards, second you might have noticed a divergence occurring: index is still moving upwards, but RSI is moving downwards. Could these be signs of a weakening index? Scenario of index being trapped inside 2 MA’s is still a possibility or would the bulls push the index up by tomorrow. Lets observe this by next week.

GLO(Chart:Daily Support: 800 Resistance: 840 )
Amazingly, this stock was able to reach the pennant’s target price. But the upward movement was blocked by the 161.8% fibonacci. Now well wait and see if the 61% fibonacci would hold as support. Interesting to note that the MACD has already crossed below the line, we may see a horizontal movement if not a downward price movement.

PAX(Chart: Daily Support: 8.0 Resistance: 8.4)
This stock has already broken out of an ascending triangle, now were on a wait and see if it would reach the target price of 9.0. If you would look closely a flag has also been formed, but its target price would be overshadowed by the ascending triangle’s target price.
Wednesday, March 08, 2006
advertiseph
(www.advertiseph.com)
-site owned by an officemate of mine. The site is an ads site which you can post your for sale stuff for free.Its still in its startup stage so expect enhancements to come along the way to better cater to your needs.
Tuesday, March 07, 2006
TraderCentral.ph
(www.tradercentral.com.ph)
 -There's a new forum in the block and it's named TraderCentral.ph. As the name implies, this forum is a convergence site for traders. Expect discussions about a stock from a technical analyst's point of view. There are also topics on TALK (Technical Analysis Learning and Knowledge base) and if your still trying to grasp the TA chit-chats in this forum, you can post a question in the TALK area and some of the members will ofcourse gladly help you out. This forum is just in its infancy stage, but given some time, this will definitely grow in to a big community.
 Kudos to TraderCentral pipol for setting up such a site.
Thursday, March 02, 2006
StockWatch (Feb 27) -delayed
Forgot to post my analysis last monday, but just for historical purposes and to validate my analysis I will still be publishing my delayed analysis :D
 PHISIX (Chart:Daily ** Resistance:2100 ** Support:2050)
As expected, last Friday’s turmoil painted the index red, but a surprising move happened on Monday. Just as I was expecting that the index would again plunge due to the Marines standoff last Sunday and the standing state of emergency, the index instead shined this Monday and closed near Thursday’s closing price. The index is currently moving sideways with a slight upward. What is very prominent is that the index is trapped in between the 65 and 130 day MA. It’s anyone’s guess as to when it would break out from the 2 MA’s. An event to look forward to is the upward crossing of MACD from below the signal line. But even if it crossed the signal line, it still might not be enough for the index to cross above the 65 day MA.

GLO (Chart:Daily ** Resistance:855 ** Suport:820)
In my last analysis, I expected GLO to pull down to 780-800 level. I guess I overshot my analysis. The stock pulled down reaching the 805 level and has continued to move upwards. Some of you may have noticed that there seemed to be a small pennant that formed in the succeeding days after the breakout. The pennant formation broke out last Thursday, but due to the turmoil last Friday, it started to dip, but was able to recover as of Monday. It is currently testing the support level, if it proves to be strong, we might still be able to see the realization of the pennant’s break out for the price to reach 880-890 levels.

PAX (Chart:Daily ** Resistance:7.80/8.00 ** Support:7.10/6.90)
It seems that this stock is trying to form an ascending triangle. But a couple of not so good things can be seen in the chart. First is the MACD opening wider and moving downwards. Second is the divergence of price from the RSI and MACD. Lets give this stock 1 more week and then we’ll check where it has gone. But as for now, my bet is that it would try to break the support at 7.10 and may still reach the 65 day MA.
 PCOR (Chart:Daily ** Resistance:4.60 ** Support: 4.40 )
The 65-day MA, which proved to be a strong support for the past days, has been broken last Friday. Price is now below the 65-day MA, I expect price to move sideways in the coming days. One thing that I overlooked in my last analysis is the divergence of the price movement from the RSI and MACD values. If the resistance proves to be strong we could expect price to either move sideways or downwards. My bet is that prices will move down near the 4.0 price level due to the divergence.
 JFC(Chart: Daily ** Resistance: 36-38 ** Support: 33)
 260 day MA has provided strong support even during last Friday’s turmoil. I still expect prices to consolidate in between 260 and 130 day MA. In the mean time well focus on other stocks.

MBT (Chart:Daily ** Resistance: 34 ** Support: 32)
Looks like this stock is now poised for break out in the coming days. Buy at 34.50-35 if it breaks out; sell if it moves down to 33.50.
AC (Chart: Daily ** Resistance: 320 ** Support: 312)
Surprising move by AC, it formed a symmetrical triangle. As with any symmetrical triangle, it could either break up or down. I was bullish on this stock that I was expecting a break out, but last Friday’s turmoil sealed the triangle’s fate as it broke down from the pattern. Currently 260 day MA is acting as a resistance. We expect price to move downwards to 300 and there is still a possibility of reaching 275-290 price level


