
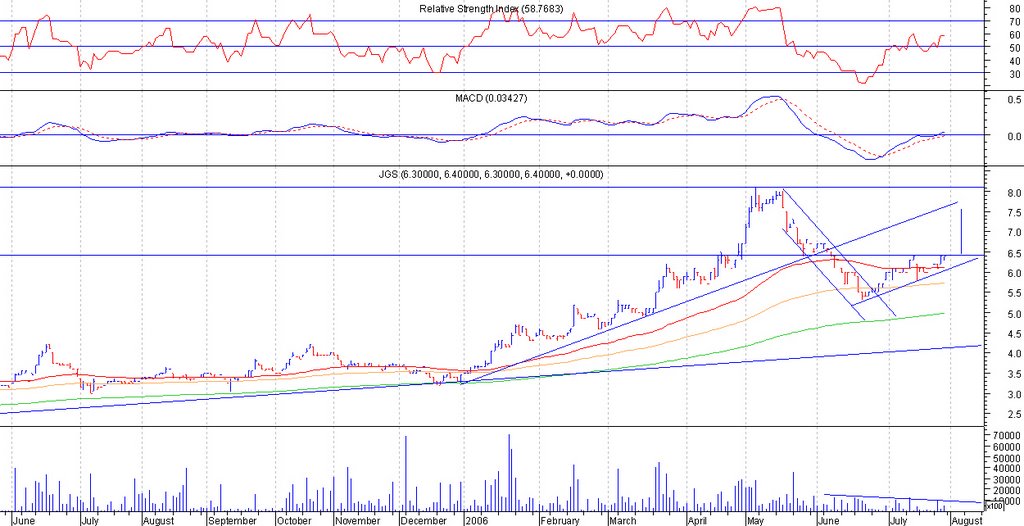
JGS (Chart: Daily ** Resistance 6.40 ** Support : 6.10)
JGS is bullish as price is above 3 MA’s and MACD is starting to move above 0. What I am seeing is an ascending triangle with resistance at 6.40. If it moves to 6.50 with volume, our target will be 7.50. Cut loss at 6.40. I would be waiting for 6.50 with volume confirmation as it may happen that the price would just consolidate and move sideways.
Search Google

Custom Search
Monday, July 31, 2006
StockWatch (Jul 31-Aug 4) JGS
Monday, July 17, 2006
StockWatch (July 17-21, 2006) ALI, BPI, LCB
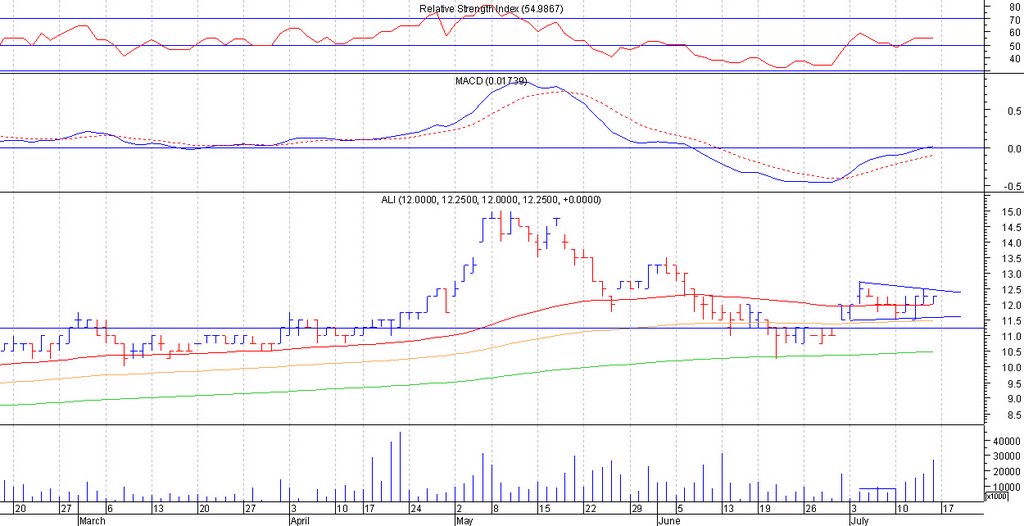
ALI (Chart : Daily ** Resistance: 12.50 ** Support: 11.75-12)
ALI is trading in a symmetrical triangle, but there is no diminishing volume. What I actually noticed is the increasing volume in the last 4 trading days. The increase in volume seems to have given a strong support at the 12 price level. If the increase in volume continues, supply at 12 level may be exhausted and we might see an upward price movement up to 13 level, the immediate previous high.
BPI(Chart: Daily ** Resistance: 51** Support: 49)
If my eyes aren’t fooling me, Im actually seeing either a symmetrical triangle or an inverse H&S forming. Both patterns share the same resistance line at 51. On the conservative side, if it is really a symmetrical triangle, we can have a target price of 56. If it is really an inverse H&S we can have a target price of 62. But ofcourse we should still be on the lookout for resistance at 55 and 60 level. Get in at 51, cut loss at 50. 
LCB ( Chart: Daily ** Resistance: 0.35 ** Support: 0.32 )
LCB is forming an ascending triangle, with resistance at 0.35. Target price is 0.40. I am not just sure if the price would be able to successfully move above the 65 day EMA as price has been bouncing off the 65 day and 130 day EMA
Subscribe to:
Posts (Atom)


