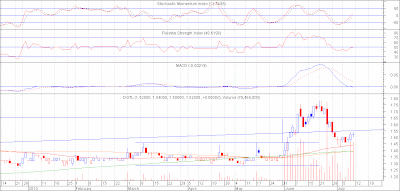
 PSEi (Chart :Daily Resistance: 3485 Support: 3402)
The resistance line that was broken last week provided support for the index and enabled it to move sideways. For the coming week, I am more inclined to say that the index might not be able to move upward for the mean time as trading last Friday moved the index higher but closed lower and formed a black candle accompanied by high value turnover. Expect further sideways movement for this coming week. The resistance line turned support is something to observe for the coming week. If it is able to provide support for the index, this might be a sign that the index will move higher and it is just consolidating above the support line. JGS (Chart: Daily Resistance: 17.50 Support: 16.25)
JGS is still a viable option to rake in some money. JGS made a return move towards support at 16.25 and never went below the support line. While on the return move to support, the volume was not large enough to cause problems, instead it just gave opportunity to accumulate more JGS at a lower price. Trading last Friday created a white candle accompanied by large volume and is definitely a very visible sign that the index is now on its way up towards the target price of 19. RCB (Chart: Daily Resistance: 25 Support: 21)
The stock brokeout from an ascending triangle with large volume. Target price is at 25, but the recent breakout diminished the returns. Watch out for a return move towards support, if this happens and support holds, then this is an opportunity to buy more of the stock
Search Google

Sunday, July 25, 2010
StockWatch (Jul 26-30, 2010): PSEi, JGS, PNB, RCB
Posted by
Mikes
at
11:01 PM
0
comments
![]()
Labels: JGS, PNB, PSEi, RCB, StockWatch
Sunday, July 18, 2010
StockWatch (Jul 19 – 23, 2010): PSEi, JGS
 PSEi (Chart: Daily Resistance: 3485 Support: 3289)
The index made an unexpected move upwards beyond the usually strong resistance level. This is a very significant event, as the resistance line usually held its position, this means the bulls are slowly winning against bears. This might be an indication of good things to come, but as of current, the index would have to move downward for now as the index is overbought. Observe the 65 day MA as this may provide support for the index.
Posted by
Mikes
at
11:52 PM
0
comments
![]()
Saturday, July 10, 2010
StockWatch (Jul 12-16, 2010): PSEi, DGTL
 PSEi (Chart: Daily Resistance:3412 Support: 3272)
The index made a good short run up, but was stopped by the resistance near the June 2008 resistance line. There was good increase in value turn over for the index on the run up, but the last trading day had a black candle with an even larger value turn over.
For next week, expect the index to move downwards. Watch out for a possible gap down as the index has always gapped down every time it reaches the resistance level. Observe the 65 day MA for support as well. It seems that the ranging action seems to be getting tighter and probably sooner or later we’ll see the result, whether the index would move further up or down. DGTL (Chart: Daily Resistance: 1.62/1.78 Support: 1.46)
DGTL seems to be on its way to recovery from the recent drop. Trading last week on Thursday and Friday was accompanied with a very large volume and maybe an indication of a recovery. There is no formation that can be seen except for a possible V formation and if this successfully forms a V pattern and breaks the neckline at 1.78, expect a target price of 2.10. This is still too early to realise, but at the very least, the stock may try to re-test previous high and at the current level, it is still a long way to go which means more opportunity for earning.
Posted by
Mikes
at
11:41 PM
0
comments
![]()
Sunday, July 04, 2010
StockWatch (Jul 05-09, 2010): PSEi
 PSEi (Chart: Daily Resistance: 3377 Support: 3258/3220/3141)
There was no follow through with the white candle formation that happened on Friday June 25, so the index had a weak approach to the long standing resistance line from June of 2008. The resistance line was still able to hold its ground making it the fifth time that the index has unsuccessfully tried to break above that resistance line.
For the coming week observe whether the 65 day MA, 130 day MA and the support line between the 2 mentioned MA’s will be able to hold its ground as well. If the 65 day MA is able to hold its ground, then the battle between the bulls and the bears is still very much in play and ranging movement for the index would continue.
Posted by
Mikes
at
12:57 AM
0
comments
![]()


