Search Google

Custom Search
Showing posts with label MEG. Show all posts

Monday, August 09, 2010

StockWatch (Aug 9-13, 2010): PSEi, MEG

PSEi (Chart: Daily Resistance: 3533 Support: 3424)

The index had a short rally last week, breaking a 2 week sideways movement. This is a positive action for the index as it showed strength and was able to move further away from the support line. The only problem is that with the recent rally, the index has reached overbought level. So for the coming week, exercise caution as selling action might take center stage.


MEG-Weekly

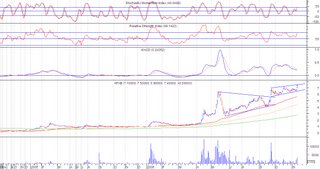
MEG (Chart :Daily Resistance: 1.77 Support: 1.50)

MEG had a rally breaking just above the resistance line of 1.74. This is short of a breakout from a cup and handle formation (see weekly chart) or an ascending triangle with a target price of 3.00. The only problem however is that the recent rally has created 2 gaps and the stock has reached overbought level. Another gap formed for this week might not be sustained and a return move towards the support may happen. Watch out for the resistance at 1.77 if this is breached with large volume, then the stock would be heading towards its target at 3.00


Monday, November 30, 2009

StockWatch (Dec 01-04, 2009): PSEi, MEG

PSEi (Chart: Daily Resistance: 3067 Support: 2974)

The index seem to have formed a rising wedge that broke down last Friday. If this is indeed a valid formation, we can expect the index to move lower next week. The breakdown is peculiar such that the breakdown formation last Friday was a white candle. This seems to be a mixed signal that I am having, since white candles are bullish, but the breakdown is definitely bearish, so I’d rather observe the coming trading days for confirmation (i.e. if it moves lower by Monday). Also observe the RSI as it moves towards the 50 level. Since March the RSI hasn’t fallen far below the 50 level, it has always managed to pull back up above 50. That RSI level may once again provide support for the index, so do observe it as it may signal a good time to buy for range trading.

On a general note, I’d recommend to lessen your position in the market because the market seems to be having a hard time moving futher upward since Aug and a large correction may happen anytime soon. So its good to limit trading to quick range trades and avoid going long for the mean time.


MEG (Chart: Daily Resistance: 1.48 Support: 1.24)

MEG seems to have broken down from a head and shoulder formation. Downward target price is around 1.10. MACD is now below the centerline and in bullish territory. Don’t be fooled by the long white candle that was created last Thursday. It was just a return move towards the breakdown price of 1.44. There was no folllow through last Friday, as it did not move higher with larger volume. The white candle last Thursday was more of bounce from the oversold RSI level of 30. For the coming week, the stock may move sideways to downward. Any chance of upward movement would be a good time to divest yourself of the stock.

Monday, June 01, 2009

StockWatch (Jun 01-05, 2009): PSEi, MEG, EDC

PSEi (Chart: Daily Resistance: 2400/2620 Support: 2300)

The index has been continously climbing for the past weeks. It looks like the bulls are confirmed to be back as we can see that the index has been very much over bought for the past 3 weeks as indicated in the RSI. I have been very much observant about the RSI being overbought for the past 3 weeks, because in a non-bullish situation, usually when the index hits the RSI overbought level, the stocks immediately turn south. However for a bulish situation, the RSI overbought level will always be triggered and the graph usually stays above the normal overbought level of 70. Also RSI overbought level is usually re-desginated to a higher level than the usual 70 (because it will always be triggerred if it is around 70). Usually the bullish overbought level is at 80 and from the looks of the index, there seems to be more steam for the index to push through since the bullish overbought level of 80 is still not triggerred.

Also what can be seen from the index’s chart is the breaking above a significant resistance line at 2350 last Friday. This line was the support line of the index when the index created a large gap down last Octoer of 2008 which conversely becomes the current level of resistance prior to Friday. This line was broken with a significant volume and it is highly possible that Friday’s bullish ending will still continue come Monday.

General Analysis:
A lot of stocks are exhibiting characteristics of a rounding bottom pattern. You can make profit on this pattern in 2 ways: One, you can ride the stock up until it reaches near resistance, which is the previous high. A lot of stocks are still halfway from reaching major resistance levels. Second is that you wait for a break-out of the pattern. Or you can do a combination of both, you ride the stock up until a certain level near resistance and sell a few for the moment and then wait for breakout and buy again. Watchout for break-outs with low volume, these are possible bear traps.


MEG (Chart: Weekly Resistance: 1.02/1.20 Support: 0.47)

MEG seems to be going sideways for now, but looking at the weekly chart, it seems that a pennant formation is brewing for this stock (pole formed last May 08). Resistance is at 1.02. A break above this level with large volume would confirm the formation. Possible target price for the pennant formation is at around 1.5


EDC (Chart: Daily Resistance 4.50 Support: 3.30/3.60)

EDC seems to be forming a cup and handle formation. The break-out price is above 4.50. Possible target price of up to 6.5. As long as the price stays above 3.30 I think this stock is still good. Watch out also for the crossing of the 65 day MA (red line) above the 260 day MA (green line)

Sunday, November 16, 2008

PSEi (Chart: Daily Resistance: 2070 Support: 1890)

Last week the index formed a higher low. It was something that I though would be good, however the succeeding trading days had very low volume and I would guess that the higher low that was formed may not be able to handle selling pressure when it happens.

The current resistance near 2070 is still a problem for the index and from the looks of the chart the index is moving is a tight range between 1890 and 2070, probably forming a small triangle formation before making another move.

There are still no signs of reversal. The MACD is opening upward which indicates bullishness for the short term, but it is still below the center line. RSI is still on the oversold side and it looks like it going to take some more time before it is able to move above the 50 level.
Usually in a bearish market, the MACD will not be able to immediately move past the center line. It would usually take some time at re-testing the center line before being able to move past it. And from the looks of the MACD, it is just half way thru its course to re-test the centerline.
MEG (Chart: Daily Resistance: 0.85 Support: 0.59 )

MEG is either forming a double bottom or a descending triangle. The neckline for the double bottom is at 0.85, while the support line for the descending triangle would be at 0.59. If the double bottom does materialize, then it has a target price of around 1.10. The descending triangle on the other hand has a target price of 0.30. The spread for the breakout of the double bottom is very small, but it would be good because it means this stock may have found bottom.


General Note: A lot of other stocks have the same chart as MEG having a possible double bottom formation (e.g. AC). But the neckline is near the support line so possible spread for the breakout is also small. It would be best to just observe where this would end.

Monday, October 06, 2008

StockWatch (Oct 6-10, 2008): PSEi, MEG, BPI

PSEi (Chart: Daily Resistance: 2627/2700 Support: 2654/2447)

The DJIA ironically went down with three lucky sevens, and the local index followed. Amazingly it was not as bad as I was expecting. With that huge drop in the DJIA I was expecting a drop of around 200 points for that day. Yes, the index did plunge to 200 points below the previous close, but it went back up and closed just above the 65 day MA. The volume was significant and was followed by another up day with nearly 100 points also with significant volume.

So what does this mean? This points us to three types of traders who were present that day, those who panicked sold down their positions. Those who got lucky are the one’s who were able to scoop up positions near the bottom of the trading day. And lastly those who wished they can still be lucky are the one’s who bought near the top of the action, these are probably traders who are still betting on better gains or those who upon seeing the index rebound from the lows started to get in again.

If you were the trader who panicked and sold down their position, there’s nothing bad about that. It’s a natural reaction, it’s acceptable and it is playing safe. Don’t feel bad about selling your position, cash is also a position. But if you sold down and bought back your position. Then that I think is a recipe for disaster. Selling at a loss is a very emotional event, which sometimes clouds our decision. Usually after selling at a loss, we are still hesitant to enter the market again. But if you entered the market because of renewed confidence within the day, usually it puts us in the situation where we are already buying too late and near the top. Selling at a loss and buying back again within the same day, is not a recommended action, not unless you have already mastered your emotions and are able to act immediately on sudden turn of events. Otherwise, I would advise for you to cool down a bit before moving in again in the market.

If you were the trader who was able to buy near the bottom, then good for you. Better check your stops and adjust them accordingly to protect your profits. This rally is definitely something that will not last.

If you were the trader who bought near the top, you should have already sold your position last week. Even if the rally was good, the market is still considered to be very volatile. Riding the momentum is ok, since there was significant volume and spread for the two days. But on the last day of trading, this should have been a warning to you to already protect your profits and sell for the mean time. The last trading day was accompanied also by significant volume, just ¼ volume away from matching the volume on the 2 day rally. This is already a sign that a lot of traders have started to cash in, and you should have also done the same if you bought near the top. Otherwise, brace your self to be long term investors, if the market turns sour.
The trading last Friday was accompanied by large volume, it is highly possible that selling will still continue next week. A symmetrical triangle can be seen in the chart, but it is still too early for a breakout. The symmetrical triangle is only pointing to us that we are still to encounter ranging actions from the market.


MEG (Chart: Daily Resistance: 1.50 Support: 1.30)

MEG is now in a tight squeeze near the apex of a possible symmetrical triangle. Breakout or breakdown may happen anytime within 1 to 2 weeks. Otherwise if this does not materialize, then we can expect further consolidation for this stock. Breakout point is at 1.50 and a good volume breakout would be 200M shares traded.


BPI (Chart: Daily Resistance: 50 Support: 40)

BPI seems to be forming an inverse head and shoulder formation. Breakout price is at 50. Target price is around 65. Wait for the breakout. It is still possible that this stock may still consolidate a few more days.

Sunday, September 21, 2008

StockWatch (Sept 22-26, 2008): PSEi, AC, MEG

PSEi (Chart: Weekly)


PSEi (Chart: Daily Resistance: 2470/2520/2630/2780 Support:2340/2289)

The PSE index felt the shockwave of the global sell down due to the successive bankruptcy announcements of the large US financial institutions. The index fell 200 points for two trading days and even moving way below the target price of the previously observed descending triangle. On the last trading day there was a reprieve from the sell down with the index gapping up and closing higher. This gap up formed a small island reversal pattern and even with a very good volume. The question is, now that we have an island reversal is it now the time to get in the market again? Probably if your investment objective is for the short term, I would say YES as the island reversal is a very clear indication that things will start to move the other way around. But for the long term, I would suggest to wait it out first before moving in the market, for the reason that the MACD is now below the center line suggesting a bearish outlook. Also looking at the weekly PSEi chart, we can see that the sell down that happened for the past two weeks had a very significant volume. With that large sell down volume, the index will find it a little bit harder to move past the resistances and it may take a while before investor confidence returns.

In the previous weeks, I have been pointing out a possible inverse head and shoulder formation. With the 2 week sell down, the inverse head and shoulder pattern that we are following got invalidated. But on the bright side, we may be seeing a formation of another possible reversal pattern, which is a double bottom. The sell down last week could probably have formed the second bottom of the double bottom formation. The possible neckline for this formation is at 2780. The complete formation of the possible second leg may take some time, probably around 1-2 months.

For those with short term investment objectives, watch out for resistances at 2530, 2630, 2700. Liquidate immediately if the index shows signs of weakness on those levels.

For those with long term investment objectives, watch out for the MACD moving above the centerline before getting in the market.

AC (Chart: Daily Resistance: 320/305 Support: 260/250)

AC seems to have formed a strong support line extending from July 2008. The stock bounced off from this support line,which may possibly be part of a symmetrical triangle. It is still too early for the breakout or breakdown of the symmetrical triangle, but it is worth following.


MEG (Chart: Quarterly)


MEG (Chart: Daily Resistance: 1.50/1.60 Support: 1.28)

Looks like MEG survived the market sell down with the help from the support line that extended from July 2008. This support line was tested for the third time and it has proven its strength against the recent market turmoil. Looking into the quarterly chart, it seems that this stock will be ending the third quarter with a superb performance. As we can see, the quarterly chart is displaying a white candle with a large volume, larger than the sell down volume of the previous two quarters. So what does this mean? Well in my opinion, we are seeing investor confidence going back into this stock. This is not yet conclusive, but it is a positive indicator for the stock. Given that indicator, and at the current price level, this may be a good find for those who would like to go long for this stock. Watch the small symmetrical triangle, breakout may happen within the next 2 weeks. Modest target price for the symmetrical triangle is at 2.10.

Sunday, August 17, 2008

StockWatch (Aug 19-22, 2008): PSEi, MEG, EDC

PSEi (Chart: Daily Resistance: 2780 Support: 2620/2600)

The index managed to gap up on the first day of trading last week, but only to be stopped by the resistance at that level. There are 2 resistances hindering the index at that level: the support line turned resistance from 2003 and the 130 day MA. The gap up on Monday was equaled in volume when the sell down happened the next day. And the following days also had large volume on the sell down days, which is a not so good indication. Plotting the troughs and peaks, we can see that there seemed to have formed a rising wedge. The characteristics of a rising wedge seem to fit the current market situation where rising wedges can be seen on a downward trending condition, which is what we recently had. And to add, the index may have already broken a short term support line, when it moved sideways last week. If this is indeed a valid rising wedge formation, then downward target price is around 2600, which is a point support line connecting the troughs in July and also the 38.2% Fib retracement level. I hope that this is an invalid rising wedge, otherwise, this might be an indication of worst things to come (rising wedges are considered bearish indications). Aside from the rising wedge formation, there may also be a possible island reversal. But this is still not confirmed as the island hasn’t been formed yet. To complete the island reversal picture, a gap down is needed. So for next week, still watch out for a possible continuation of the sell down as volume was noticeably large on the down days last week and the RSI is still very much oversold. Watch out also for a possible inverse head and shoulder formation if the support at 2600 holds.


MEG (Chart: Daily Resistance: 1.72 Support: 1.30/1.20)

MEG is not in a good position currently with a large volume and large spread on the sell down last Friday. A rising wedge can also be seen in the chart which was broken last week. The target price of the rising wedge was also reached. This is a stock to avoid for now given the large spread and volume on the sell down. Next support is at 1.30 which is the previous resistance on the small ascending triangle, while 1.20 is a point in the support line connecting the troughs in July.

EDC (Chart: Daily Resistance: 4.75 Support: 4.40)

EDC is showing some signs of positive divergence with the price going lower and RSI and MACD creating higher lows. Aside from the positive divergence, the stock seems to be forming a falling wedege, which is a bullish indicator. A peculiar thing about this falling wedge is that it can be found in a downward trending action. A falling wedge in a downward trending stock is a bullish indication and may probably indicate a possible reversal. What we are waiting for now is a break in the resistance line. Possible breakout point is at 4.70. If broken with volume target price is around 5.70. Now an important ingredient for the breakout is volume. Since this stock is trending downwards, in order to pull out of its dive, we need a very large volume to consider that we will be having a prosperous breakout. Current price level at 4.55 is already a good entry level, just watch out for support at 4.40 and sell if support is broken.

Sunday, July 27, 2008

StockWatch (Jul 28 – Aug 01, 2008): PSEi, MEG, MBT, BPC

PSEi (Chart: Daily Resistance: 2650 Support: 2507)

Looks like this is it! No, not a bull run, but a respite from the continuous downward movement by the index. The support was respected last week with the index moving higher. We now have a higher low, which is a very good sign. But that is not the only good sign we’re seeing in the chart, last Thursday, the index broke resistance at 2507 with a big spread and large volume! And it looks like the resistance that was broken was part of an ascending triangle with a possible TP @ 2710. The trading last Friday saw the index lower, however, even if it is lower, it was able to stay above the resistance-turned-support line. We will be able to confirm next week if the break will push through or whether it will buck the selling pressure and fall below the support. I am certain that this is now the start of the consolidation phase, so watchout for stocks trading within a range. For those going long on the stocks, this might be the best time to catch some bargain stocks, just look for stocks that are able to form a higher low with good volume.


MEG (Chart: Daily Resistance: 1.46/1.66/2.24 Support: 1.10/1.06)

MEG had 2 gap ups for last week, breaking resistance at 1.30. The break was accompanied by good volume and may have broken an ascending triangle with a possible TP @ 1.54. The current price level is already near the TP price, so it is quite late to get into the stock. Since the market is going into consolidation phase, it is good to observe possible peaks and troughs for this stock for a possible range trade strategy. Watch out for the 65 day MA which is also a resistance. The volume for the past 4 weeks has been good so it is also a good indication that this stock is pulling out of the bearish dive.

MBT (Chart: Daily Resistance: 36.50 Support: 30.50)

MBT has been trading within a downward trending channel. Currently a positive divergence can be seen from the chart with the price moving lower while the MACD moving higher. What made this divergence significant is that the it can be seen within a shorter time frame unlike other instances of divergence where in the time frame was wider. Watchout for the MACD of this stock as it is now near the zero line and it is possible that this may have some potential when the zero line is broken. As of current, it is not recommended to get in this stock at the current price level, a good entry point would be near support at 30.


BPC (Chart: Daily Resistance: 1.66/2.60 Support: 1.16)

BPC had a breakout from a small sideways channel. Possible TP at 1.34, however at the current price level, the TP is already near. Volume has been great at the breakout, so the support may hold if it is tested. Watchout for the 65 day MA at 1.66 as this is a resistance level. Also, for this stock, observe the possible peak and trough to determine the possible range trade strategy.

Sunday, March 09, 2008

In Retrospect: MEG

MEG

Looks like MEG lost its bullish steam, the stock went to as low as 2.40 on the first trading day and last Friday, it went below 2.40 to as low as 2.36. The trading last Friday opened and closed on the same level indicating indecision for movement of the stock. As of current, since it has gapped down its more likely that this stock will move further downwards for the coming week. Next possible support is at 2.20, which is the resistance-turned-support line

Sunday, March 02, 2008

StockWatch (Feb 25-29, 2008): PSEi, MEG

PSEi (Chart: Daily Resistance: 3120-3150 Support: 3060)

The index had a small rally last week only to be stopped by the resistance line extending from the recent high of 3320. As of current, this resistance line was able to hold 3 instances of advance by the index, all have been unsuccessful at going beyond the resistance line. By the coming week we will be able to see if the recent rally of the index still carries the necessary momentum to be able to break resistance or if it would still prove to be a strong resistance.


MEG (Chart: Daily Resistance: 2.70/3.00 Support: 2.42)


MEG went to as low as 2.04 on the first trading day before it was bought up with large volume the following day. The stock also gapped up with a large volume on Thursday and this gap up seemed to have broken out of what looks like a falling wedge or a downward channel. Either way, the target price for the breakout is around 3.00. Upcoming resistance is at 2.70 and 3.00 which are the previous high. Aside from the breakout, the bullish divergence also materialized and as well as the cross over of the MACD above the signal line. We have a couple of bullish signals confirming the breakout and we can expect the price to move higher for the coming days. If you bought at 2.50, cutloss can be at around 2.40 if incase the breakout turns south. MACD is still below zero line, so trading this stock should be for the short term only.

Sunday, February 24, 2008

StockWatch (Feb 25-29, 2008): PSEi, RLC, MEG

PSEi (Chart: Daily Resistance: 3170/ 3320 Support: 3000/2950)

The initial descending triangle formation that was spotted last week was broken down on the first day of trading but was able to recoup the loss and successfully close above the support line of 3170. However the support at 3170 was short lived as the index broke down last Friday with a huge spread. The TP for the breakdown is around 3000, which is also a psychological support. The next support is at 2950, the previous low. The interesting part is that if support at 2950-3000 holds, then the index is a possible candidate for a double bottom, a reversal indicator from the recent decline of the stock market from October 2007, but ofcourse this remains to be seen. The bad part of it is that if support doesn’t hold, and proceeds to takeout the support at 2870 from the previous low of August 2007, then we have ourselves a grim picture of a breakdown from a double top, but judging from the RSI level, I think the grim picture of a breakdown from a double top would be very small as the index is still currently near oversold level. For now, the trading strategy would be more of staying on the sidelines until a bounce happens. Keep watch also for other stocks that might be forming a double bottom, a falling wedge pattern or showing signs of a bullish divergence.


RLC (Chart: Daily Resistance: 12/14.50 Support: 11.25/10.50)

RLC is one of those stocks that are displaying a double bottom formation. Looking at its past movement, we can see that it has formed a H&S formation from Sept-Dec of 2007. It brokedown from this formation by the second week of December and has since been moving downwards. The target price of the breakdown from the H&S formation has been reached at 11.25 and was able to rally back to a high of 14.50 before moving downwards again. Currently, it seems that this stock might be forming a double bottom assuming that support at 11.25 holds. If support at 11.25 is broken, the next support is at 10.25 which is the support line extending from Aug 2007 up to Jan 2008. If it bounces from this support line, watch out for a bullish divergence formation for the MACD and RSI. As of the moment, both of the indicators still has the possibility of forming a bullish divergence. If it does bounce from support at 10.50, this gives more credibility to a possible falling wedge formation with resistance at around 12. For the bottom fishers, 10.50 would be a better level to get in and cutting immediately if it goes below 10.


MEG (Chart: Daily Resistance 2.44 Support: 2.20/1.90)

MEG is also one of those stocks that may be displaying signs of bullish divergence. Looking at the previous movements, the stock brokedown from a symmetrical triangle (or could also be a H&S formation) last Jan 2008 and has since been moving downward. From mid January, the price action moved sideways and as of last Friday it has recently broken down again from the sideward channel. Considering the symmetrical triangle where it initially brokedown from, it has now reached the TP of 2.20. But considering the sideways channel where it recently brokedown, we can still see further possible downward movement down to the 1.90 level. As of current this is a candidate for a bullish divergence as the price has formed a lower low, while the MACD and RSI is still way too far from creating lower lows, which means there is a higher possibility for the MACD and RSI to form a higher low. We can confirm the bullish divergence by an MACD crossover of the signal line.

Sunday, November 04, 2007

In Retrospect: TA, SMCB, GEO, PX, MEG

TA

Target price for TA is reached and has gone beyond up to 2.30 establishing a new high. There is profit taking as of the moment, but price may still move up once profit taking is over. Profit taking may push the price down to 1.80 level, the 38.2% fib retracement.

SMCB

SMCB moved lower and formed a double bottom at 59.50. It invalidated the earlier triangle that I saw. It seems now that 59.50 is a strong support now. Resistance is still at 66 and the bullish divergence is still intact. The double bottom I think is another confirmation that the downward trend is reversing. We have to look at the upcoming resistance at 66, if it is a strong resistance and produces a lower high for the price and a higher high for the MACD and RSI, this is another confirmation of the trend reversal.

GEO

GEO was one of the stocks that was definitely affected by the Glorietta 2 blast creating a gap down on the first trading day after the blast. It has now covered the gap made. This rally would be a good time to sell as there is still no clear bullish indication to contradict the bearish divergence that was seen last week. Price may still move to as high as 2.90 or beyond, however watch for MACD and RSI forming a lower high.

PX

PX formed a higher high for the price, but the RSI and MACD has yet to register a higher high. RSI’s bearish divergence is still intact and now we watch for the MACD if it would follow to exhibit a bearish divergence.

MEG

Bearish divergence on the RSI is still intact. It’s still a wait and see if other indicators will confirm the bearish divergence.

Sunday, October 21, 2007

StockWatch (Oct 22-26, 2007): PSEi, TA, SMCB, GEO, PX, MEG


PSEi (Chart: Daily Resistance: 3835/3863/3896 Support: 3750/3600)

Cautious trading may prevail next week as a reaction to the Glorietta 2 bombing. I think that those spooked by the tragic terroristic act will sell immediately on Monday. However, even if the bombing did not happen, our market is really on its way down for the short term. As seen in the chart, after breaking the previous high, the index was not able to sustain its position above the support line. It eventually moved below the support line and even lower. As of current, the MACD has crossed below the signal line, triggering a sell for the short term. A good picture though that is currently forming in the chart is a falling wedge. Given the recent bullishness from the index’s lowest last August, to its highest this October, it is highly likely that current downward move we are experiencing is a prelude to the formation of the falling wedge. A falling wedge indicates short term bearishness and once it breaks above the resistance line, further bullish sentiment is expected. The target level of the falling wedge is around 3900.

TA (Chart: Daily Resistance: 1.52 Support:1.34 )

TA gapped up on Friday with a large volume. Conservative target price of the breakout is at 1.80.

SMCB( Chart: Daily Resistance: 66 Support: 61)

SMCB is exhibiting a bullish divergence. Both MACD and RSI registered a higher high, but the price registered lower highs. Also, it seems that it is forming a symmetrical triangle as of current with 61 as support and 66 as resistance/break out level. The target price for the symmetrical triangle is at 74. This stock may encounter further resistance from the 3 MA’s at the levels of 69-72.

GEO(Chart: Daily Resistance: 2.90 Support: 2.48)
GEO is exhibiting signs of bearish divergence. Both RSI and MACD registered a lower high, but the price still registered a higher high. Sell.

PX (Chart:Daily Resistance: 9.70 Support: 9.50/8.90)
PX is also exhibiting bearish divergence of RSI against price. Price formed a higher high, but RSI formed lower high. Sell.

MEG (Chart: Daily Resistance: 4.60 Support: 4.25/3.85)

MEG will probably exhibit a bearish divergence between RSI and Price. As of current, the peak of the RSI is not yet formed, but considering the price has already gone higher, RSI still has not registered a higher high. We are just waiting for confirmation of the RSI peak forming a lower high. It would be best to sell on rally.

Friday, April 06, 2007

In Retrospect: MEG, MIC, MBT, AJO

MEG broke out of the ascending triangle with significant but insufficient volume. The valid break out volume should be at least 200M shares traded, the actual break out volume was around 70M shares. Even though the stock did not have a valid breakout, it remains bullish according to the MACD. Need to watch out though, as the stock’s price moves higher creating higher highs, the MACD also needs to create the same thing, otherwise, we might be seeing a divergence of price and MACD. Recommendation: Hold until the divergence is confirmed, if the divergence is confirmed, start selling on rallies.


MIC traded sideways this week. The 2.40 price level held its ground. The stock may still move sideways to downward this coming week. So still watch out for 2.40 and 2.30 levels for buying opportunity.


MBT price movement went sideways last week. Target price is still not reached. A noticeable event last Wednesday’s trade is that volume picked up significantly to 6M shares traded. Hopefully the increase in volume will help in closing the gap between 63.50 and 66. Recommendation: The stock can still be bought at the 62-63 price levels.


AJO H&S pattern is still intact. We are still waiting for the break of the neck line. Currently, the 65 day MA at 0.70 seems to have provided a temporary support for the price. MACD still doesn’t look good, but price may still have a temporary sideward to up movement delaying the downward move. Recommendation: Sell on rallies.

Saturday, March 31, 2007

In Retrospect: MERB, MEG, UPM, MIC, AEV

MERB ‘s “looks as if” did not materialize. MACD crossed upward but went back below the signal line while price moved sideways and has touched the support line on the last trading day. On the coming week watch out for the support line at 69 and the resistance line at 72, the symmetrical triangle is intact, but it is now near the apex, so there is a high probability of the symmetrical triangle being invalidated.

MEG had a failed break out from an ascending triangle. Price broke the resistance line at 3.30. Volume only came in when the price pulled back below 3.30. Interestingly, even if the ascending triangle is invalidated, we can expect another ascending triangle in the formation, with resistance at 3.45 and target price at 4.30


UPM also had a failed break out from a symmetrical triangle. Volume was very high on the breakout day, but it failed to sustain the upward move. Price went as high as 0.85 but closed just 1 fluc above the opening price. It is now forming an ascending triangle with reisstance at 0.85. But the volume from the failed break out somehow invalidates the pattern. Who knows maybe the price movement will just inch its way up as MACD is already indicated a buy long signal.

MIC moved sideways before the failed breakout from a symmetrical triangle. Volume was significantly high on breakout point, but was not sufficient enough to indicate a proper break out. Price may still move down to sideways this coming week so watch out for support at 2.40, 2.30, 2.18 and 1.96. Though the previous symmetrical triangle resistance did not hold, we can still expect a symmetrical triangle, but this time with a higher resistance level.
AEV tried to rally on the last day of trading, closing higher but has signs of weakness as it was unable to move above the 65 day MA. We could expect some up to sideways movement this week with the 65 day MA acting as resistance, but if the following trading days is still accompanied with low volume, the descending triangle still holds, the rally just adjusted the resistance level. A chance to cash in on the rally, better to be liquid than sorry.

Sunday, March 25, 2007

StockWatch (Mar 26-30, 2007) : MERB, MEG, UPM, MIC, AEV

MERB (Chart: Daily Resistance: 62/73-75 Support: 67.50)

MERB looks as if forming a symmetrical triangle. MACD looks as if it is about to cross over, but all of this is just “looks as if”. Watch out for resistance at 73, if price breaks out, target price is around 85. The breakout has to have a big volume as it has to struggle on its upward move because of the resistance along the way up. Recommendation: Buy only on break out. Watch out for resistance levels 75, 78, 80

MEG (Chart: Daily Resistance: 3.30 Support: 3.10/2.95)

MEG is forming an ascending triangle. A gap up with high volume happened last Thursday which suggests the stocks strength. MACD has slightly crossed above signal line. The resistance at 3.30 needs to be broken with high volume, otherwise if there was no volume, the movement might be stopped by another resistance at 3.45 and may probably move back in the triangle. Recommendation: Buy on breakout only. The price movement is very near the apex of the ascending triangle, there is still a high possibility that the formation might be invalidated. The target price is at 4.0. You can still buy this stock at 3.50-3.60 level for a substantial gain if it does move with volume. Volume needs to be higher than 100M trades.

UPM (Chart: Daily Resistance: 0.80 Support: 0.69)

UPM is forming a symmetrical triangle. But it currently needs to break out from the 65 day MA. This stock still has a long way to go before breaking out. One good sign though is the MACD crossing over signal line and the upcoming cross above the zero line. Let’s see what would happen in a couple of days. This stock could either move above 65 day MA or trade the range within the 65 day MA and the support line.

MIC (Chart: Daily Resistance: 2.50 Support: 1.58)

MIC is also forming a symmetrical triangle. At this point, the price may still trade the range. If price does break out of the area pattern, target price is 4.80. Recommendation: Buy only on break out. Buying at this level might be costly as price may still move either sideways or downwards.

AEV( Chart : Daily Resistance: 8.30 Support: 7.80)

AEV is forming a descending triangle. Price movement has respected the resistance line on 2 occasions and on the last 2 trading days; AEV touched resistance for the third time at 8.40 and fell back. At this point, the price movement is squeezed by the resistance line and the 65 day MA. Price may either move sideways if the 65 day MA would hold, otherwise the price may move further down, re-testing support at 7.80 or 7.70. If the descending triangle holds and price breaks down, price may move further down to 6.0 level. Watch out for support at 7.20, the long term support, the 130 and 260 day MA on its way down.

Sunday, December 03, 2006

In Retrospect: MEG, JFC, VUL, WPI

Checking on the previous week’s analysis

MEG

The price went down as low as 1.96 and rallied up again for two days. The descending triangle that is in its early formation is invalidated by the increase in volume during the Nov 28 downward movement. This downward movement further established a new support. Currently MEG is still a stock to avoid as the MACD is still in a bearish stance. If the price at 2.30 is not broken and instead a new lower peak is formed, it is a further confirmation of the bearish move.

JFC

The Nov 28 downward movement invalidated the ascending triangle being formed. But this downward movement established a support level at 39. Interestingly, the upward movement on the last day of trading during last week was accompanied by high volume, which increases the holders at 39-40 level, providing a strong support in those levels. Though MACD is still bearish, I believe that because of the increase in volume prices may start to move up, possibly trying to re-test the resistance at 42.

VUL

The pole formed for two successive trading days was followed by a flag formation, but was unsuccessful at breaking the resistance. Further correction may still follow as stock is already overbought.

WPI

The ascending triangle formation failed and broke the support. The MACD is now in a bearish stance.

Sunday, November 26, 2006

StockWatch (Nov 27-30, 2006): MEG, JFC, VUL, WPI


MEG( Chart: Daily Resistance: 2.2 Support: 1.96)

As previously noted in the Stock Watch (Nov 13-17) post, the stock was in a bearish move which was further confirmed during the past week. The bounce up was not able to cover the gap created by the downward movement and it further slid down. Currently the stock is still bearish as MACD is still on a downward movement. The movement during the 2 trading days covered the gap up created by the bounce. The stock is in the position of forming a descending triangle. If it does reach the support of 1.96, this could be a further confirmation of the descending triangle


JFC (Chart: Daily Resistance: 42.50 Support 40.50)


JFC is forming a small ascending triangle with resistance at 42.50. If resistance is broken, we could see a move towards 46. But before reaching 46, it needs to break the previous high of 44. If the ascending triangle is broken successfully, we may see price to go beyond 44. If not, then 44 may be a strong resistance


VUL( Chart: Daily Resistance: 0.98 Support: 0.83)

VUL is a possible candidate for a Pennant/Flag formation. The pole is already establish, just waiting for the flag/penant


WPI (Chart: Daily Resistance: 0.68 Support: 0.59)

WPI is a possible ascending triangle with resistance at 0.68. But a volume of above 18M is needed for a good break out

Sunday, November 12, 2006

StockWatch (Nov 13-17, 2006) Mining Index, LCB, APXB, PX, MEG, JGS

Mining Index

Just something to note: The mining index registered an unusual increase in volume last Friday. The index gapped up with high volume, which indicates that traders have started coming in. We may see mining stocks having their day in this bullish market.


LCB (Chart: Daily Resistance: 0.35/0.38 Support: 0.30/0.27)

LCB picked up in volume lately. No pattern has emerged, except for an upward channel. But with the pickup in volume, and the mining index picking up, we could hope that LCB would ride with the wave towards the long term resistance at 0.45 level.

APXB ( Chart: Daily Resistance: 7.50 Support: 6.50)

Interesting to note: APXB gapped up with volume. High possibility of upward movement to break the resistance as MACD positioning to cross above the signal line. Although RSI might be oversold, seeing previous RSI levels may indicate that a move beyond the oversold level is a possibility. Hopefully APXB (and APX) could also ride the mining wave.

PX ( Chart: Daily Resistance: 5.00/5.50 Support: 4.30/4.00)
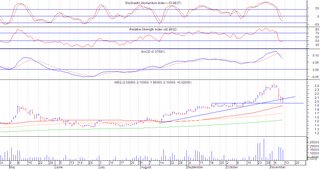
Interesting to note: PX gapped up and broke out from a short term resistance line of 4.30. The increase in volume hopefully would bring the price up to its previous high of 5.90

MEG( Chart: Daily Resistance: 2.44 Support: 1.96)

MEG has had a bearish move recently. MACD crossed below the signal line accompanied with volume. No pattern has emerged yet, but what MEG needs is additional volume in its upward move for it to reach the previous high. If more volume does not come in, we could see a side to downward move. For now, a bounce from the support might be forthcoming.


JGS ( Chart : Daily Resistance: 8.10 Support: 7.90/7.40)

JGS has formed a rounding bottom pattern, with the characteristics of high volume activity on the sides of the pattern. But recent price movements have somehow started to invalidate the pattern as no high volume came to break the resistance and the price continued its sideward movement. RSI is currently oversold and MACD has crossed below signal line, which might indicate an up coming move downwards. For now it would be best to take profit and possibly pick it up later.