PSEi (Chart: Daily Resistance:3412 Support: 3272)
The index made a good short run up, but was stopped by the resistance near the June 2008 resistance line. There was good increase in value turn over for the index on the run up, but the last trading day had a black candle with an even larger value turn over.
For next week, expect the index to move downwards. Watch out for a possible gap down as the index has always gapped down every time it reaches the resistance level. Observe the 65 day MA for support as well. It seems that the ranging action seems to be getting tighter and probably sooner or later we’ll see the result, whether the index would move further up or down.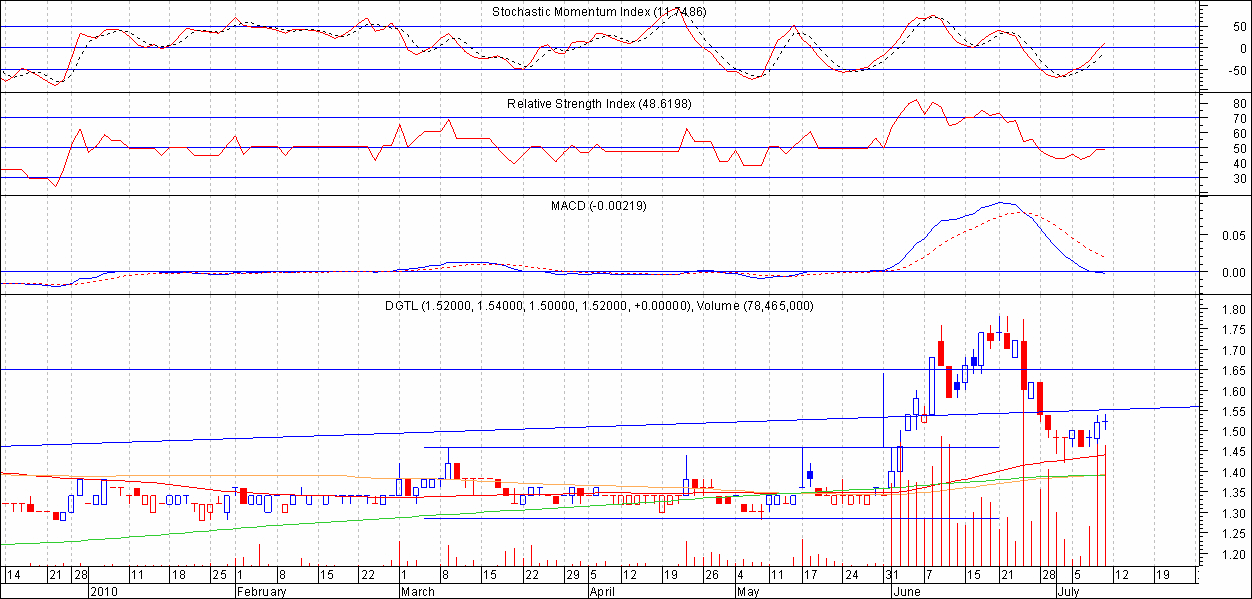 DGTL (Chart: Daily Resistance: 1.62/1.78 Support: 1.46)
DGTL seems to be on its way to recovery from the recent drop. Trading last week on Thursday and Friday was accompanied with a very large volume and maybe an indication of a recovery. There is no formation that can be seen except for a possible V formation and if this successfully forms a V pattern and breaks the neckline at 1.78, expect a target price of 2.10. This is still too early to realise, but at the very least, the stock may try to re-test previous high and at the current level, it is still a long way to go which means more opportunity for earning.
Search Google

Saturday, July 10, 2010
StockWatch (Jul 12-16, 2010): PSEi, DGTL

Sunday, June 06, 2010
StockWatch (June 7-11, 2010): PSEi, MER, DGTL
 PSEi (Chart : Daily Resistance: 3367 Support: 3195/3106)
The index had a good run up last week. However, there is still the resistance from June 2008 which is affecting the upward movement of the index. As of current, there is a battle between bulls and bears, as the trading last Friday ended with a stalemate. But based on the RSI and the Stochastics, there is a higher possibility that the bears will win in the coming week, so it is best to lighten your load.
 MER (Chart: Daily Resistance: 197 Support: 160)
MER has exhibited large volume lately, with the last trading day plotting the highest volume since December last year. Looking at the chart, there is a horizontal channel which is acting as a resistance lately. For the next week, expect the stock to move lower as the RSI is now overbought.
 DGTL (Chart: Daily Resistance: 1.65 Support: 1.46)
DGTL broke out of a sideways channel with a gap. Target price is near 1.65.
Be cautious of buying at this point as target price is near and there is a higher possibility of the stock to move lower towards the end of this week as the RSI is very much overbought.
Sunday, October 19, 2008
StockWatch (Oct 20-24, 2008) : PSEi, GLO, DGTL, PLTL
 PSEi (Chart: Daily Resistance: 2176/2292 Support: 2080)
The index experienced a temporary relief during the beginning of last week, but this was capped by the resistance near 2270 and the index again fell and created a big gap. As of current, the index is still respecting the support line formed from August of 2007 connecting the trough of July 2008 and recently also connecting the last 2 week’s low. This week will be the judgement week for that support line to see if it would still hold.
There is currently a manifestation of a possible double bottom. But this double bottom may be a reversal only for the short term trend. Its neckline is at 2176, with a possible target price at around 2500. If the support line is broken, then the possible double bottom will be invalidated.
Still, there is no clear reversal for the current bear market. The MACD is still below the centerline so this means hold only for the short term. The market is still very much oversold, a lot of stocks are still below the RSI 30, so there is s higher probability of another short rally by this week.
 GLO (Chart: Daily Resistance: 980 Support: 820)
GLO just recently turned very bearish as the standing support line connecting the troughs from 2002 was broken with large spread and good volume. The support line was initially tested last Sept 2008 and it stood its ground. Two weeks ago, it was again tested and broken with significant volume. The stock was able to rally for a short time and moved above the support line, but went further down last Thursday and Friday again with big spread and good volume. The break down that happened last week is further confirmation of the breakdown that happened 2 weeks ago.
The next support for this stock is at 820, which is the previous low from around June of 2006.
 DGTL (Chart: Daily Resistance: 1.28 Support: 1.12/1.10)
Looks like all communications are down from the current bear market storm. DGTL, like GLO also broke down from its standing support line since 2002. The symmetrical triangle that I was previously so much hoping to breakout, went down instead. Its official, DGTL, GLO and TEL are all in the very bearish region. TEL broke its support line since June. PLTL is the only communications stock that still hasn’t broken its support line from 2003, although, it has already broken its support line from 2006. (See chart below)
Next support line for DGTL is at 1.10 which is a previous low from 2007.
 PLTL (Chart: Daily Resistance: 7.40 Support:6.50)
PLTL unlike TEL,GLO and DGTL still has a long way to go before breaking the support from 2003. But it has already broken support from 2006. Compared to the other telecoms stock, I can say that PLTL still has hope amidst the bearish market, but, were still not out of the woods, so let’s further observe the movements for this stock. Next support for this stock is at 6.50 which is a previous low.
Monday, August 11, 2008
StockWatch (Aug 11-15, 2008): PSEi, DGTL, AC, MBT
 PSEi (Chart: Daily Resistance: 2760/2800/2876/3019 Support: 2650/2613/2570)
The index had a very good bullish action last week. I was expecting the index to buckle to selling pressure last week as RSI is near overbought, but it kept on moving upward. A gap up also happened last week breaking the 65 day MA resistance as well as the previous high of 2650, this was accompanied by a very large volume. Although there was significant market action from the previous days, there are still a couple of resistances that the index would have to deal along the way up. An upcoming resistance level is the broken support line from an upward channel extending from 2003 (2760). Next is the 130 day MA (2800), followed by broken support neck line of the double top formation last year (2876), and last is another broken support line from a down channel (3019). Since the correction did not happen last week, expect that the correction may happen anytime within the coming week. We are currently seeing an increase in volume for the past days, hopefully this is sustained for the coming weeks so that the index may clear those resistances.
 DGTL (Chart: Monthly Resistance: 1.60 Support: 1.26)
I noticed that zooming out and looking at the Monthly charts for DGTL shows a very good cup and handle formation. The handle has a resistance or breakout point at 1.60 and has a TP of 2.70. However, since we are looking at a monthly view of the chart, this break out may not happen for atleast another 1 to 3 months. For those going long, this is a good stock to get into.
 AC (Chart: Daily Resistance: 320/352.50/380 Support: 305)
I never thought that AC would break the neckline of a double bottom, but it did and trading last week also saw a gap up with volume. Target price for the double bottom is at 325. The only problem that is bothering me for this stock is that there isn’t enough volume on breakout of the double bottom. Hopefully volume for the coming days would pick up. Next resistance is at 320 which is the 130 day MA then followed by 352.50 which is the previous high. Correction may happen this coming week, so for those who would like to get in this stock, this would be a good opportunity. For the next trading days, watch out as there may be a possibility of a bigger inverse H&S formation. The left should formed in between April to June, if the resistance at 352.50 holds, then this may be the formation of the neck line of the inverse head and shoulder formation.
 MBT (Chart: Daily Resistance: 41 Support: 36)
The positive divergence seen previously for this stock materialized into a break from the downward channel. Aside from the break out from the downward channel, the stock also managed to move past the 65 and 130 day MA. There was sufficient volume on breakout of the channel. However, succeeding trading days where a white candle can be found has lesser volume. What I am hoping to see is more volume on white candles. Currently, the stock is overbought and there is a possibility of a correct for the coming week, this would be a great opportunity for getting into the stock. There is a possibility that an inverse head and shoulder may be forming. The left shoulder formed in between April to June. If the resistance is strong at the current level, then it is possible that we may have formed as neckline. The left should is still to be formed so watch out for this.
Monday, August 04, 2008
StockWatch (Aug 05-08, 2008): PSEi, DGTL
 PSEi (Chart: Daily Resistance: 2620/2650/2715 Support: 2507)
Looks like the index is having a hard time moving past the 65 day MA. Trading last Thursday saw the index close lower with larger volume. Succeeding trading after that only had small volume. Also given the current RSI level, the index is near overbought and we may see some correction within the week. Watch out for support at 2507, as long as the index respects that support level, the index is still in a good condition. The support at 2507 is one of the points in the support line connecting the troughs in July. Almost all of the stocks currently are having a hard time moving past their 65 day MA’s, so it would be best to lock in the profit for today.
 DGTL (Chart: Daily Resistance: 1.46 Support: 1.22)
DGTL seems to have formed a rounding bottom, but we may not be able to see a breakout for the coming days as the RSI is now very much oversold. It is good to observe this stock for the coming days, as this may transform into a cup formation. The stock is currently consolidating as seen in the 3 MA’s. It is also worth noting that the stock stood its ground when the general market was being battered. It did not continue moving lower than the support line. So if you are going long on this stock, current price level is already good as it is near the support line from extending from 2004.
Sunday, July 06, 2008
StockWatch (Jul 07-11, 2008): PSEi, LR, RLC, DGTL
 PSEi Weekly Chart
 PSEi (Chart: Daily Resistance: 2425-2400 Support: 2289/2100)
The support line from Jan 2008 was tested for the 5th time last week and it was not able to contain the index’s downward move. The index, punched thru the support line moving downwards up to the lowest at 2289. Looking at the weekly chart, we can see that there was a support at that level, which was the 260-MA on the weekly chart at 2300. However, this may just be a temporary support for the index as judging from the break down from the channel, there is a possibility that the index could still move lower towards the downward channel’s target price near 2100. Last Friday’s upward move may just be a short rally as there was no volume to support the upward movement. Still trading strategy would be to keep liquid. No signs of reversal can be seen from the charts.
Note: There are a lot of stocks that are very much oversold, be careful on trading these stocks, as any upward move might just be a short rally from being very oversold. If you are to trade these kinds of stocks, keep an eye on your stops as the market is still very bearish.
 LR (Chart: Daily Resistance: 2.80 Support: 2.24/2.06)
LR seems to be a promising stock to follow. The stock had a large spread and large volume last Friday. Also worth noting is the price which is now above the 3 moving averages. This denotes strength for the stock. Looking also at the MACD, the MACD is now above the zero line and now poised to cross above the signal line, both signs also indicate strength in the stock. But how long can this strength last is another question that may not have a definite answer. As of now, resistance is at 2.80, which is the previous high. We can assume for now that the strength that we are seeing can take this stock from 2.60 to 2.80, beyond that is still a wait and see. I am more inclined to call that 2.80 will be a strong resistance, judging from the RSI which is now near overbought.
 RLC (Chart: Daily Resistance: 6.30-6.60/ 9.50 Support: 6.0)
RLC is one of those stocks that are very much oversold. What caught my attention for this stock is the unusual large volume last Friday which may translate to a strong support at 6.00. Resistance is currently at 6.30-6.60 which is the gap down formed last Thursday. If you are to trade this stock, keep track of your stops. It is possible that the stock may reach beyond 8.00, based only from the 38.2% fib retracement, which is at 8.30.
 DGTL (Chart: Daily Resistance: 1.46 Support: 1.24)
Comparing DGTL with the PSEi, DGTL seems to be in a better position than the index. As we can see, the recent downward movement of the stock is not really part of a bearish cycle, but more part of the consolidation that is happening for this stock. Looking at the chart, we can see that the MACD has been oscillating near the zero line which indicates consolidation and it is also evident on the price action. Currently there is an upcoming support at 1.24; it would be good if the stock is able to stay above this support line from Sept 2004. Otherwise, if the stock moves lower than the support line, then this might probably be the end of the consolidation phase for this stock and may move to a bearish phase. But judging again from the RSI which is very much oversold, it is highly probable that the support at 1.24 may hold.
Monday, August 27, 2007
In Retrospect: PAX, JFC, DGTL
PAX
PAX moved with the market last week, going to as high as 14. A short upward move and sideways movement characterized its price action. However, we could see that even if there had been an upward move for this stock, it has consistently closed lower than the opening price. This means the bulls are still overpowered by the bears trying to sell the stock. Also the volume is still lethargic, which means there aren’t enough buyers. If this goes up and is able to close the gaps without a significant increase in volume, then this means the upward move was just superficial. Watch out for price levels 14.25 the lower end of the gap, 15.25 higher end of the gap, 16.25 and 19.00 the 23.6% and 38.2% Fibonacci retracement price levels. One good thing to note for this stock is that the MACD is positioned to cross above the signal line. It’s a wait-and-see if this cross above the signal line would attract more volume. Still be on the look out for the formation of an island reversal pattern.
JFC
The trough that we are waiting is now formed and this means that our positive divergence is confirmed. This stock went to as high as 53 with sufficient volume. However, the 2 MA’s are currently blocking its way and has proven to be strong resistance. Price may move sideways to down for this week. It may go to as low as 49 which is its previous low or beyond.
DGTL
The positive divergence is also confirmed for DGTL as the trough has formed. However, the upward movement of the stock was not accompanied by volume, which means its sideways movement for this stock for now until it’s able to get more volume. Any further upward move without sufficient volume may not be good enough to break out from the downward channel that it is currently in.
Monday, August 20, 2007
StockWatch (Aug 20-24, 2007): PSEi, PAX, JFC, DGTL
 PSEi (Chart: Daily Resistance: 2940/3100/3220 Support: 2740/2440)
The index went thru the 260day MA, even breaking the long term support line connecting the peaks from 2002 and 2006. Next support level is at around 2740, the long term support line connecting the peaks of 2002 and 2005 and afterwards at 2440, the support line connecting the troughs of 2003 and 2006. With last Friday’s Fed’s intervention in the US market by cutting the discount rates, hopefully our local market would also react positively with that event. There is still no sign of reversal, so it might be possible that upward moves maybe short lived due to heavy selling from those who were stuck in the 4 weeks straight selling. Resistance at 2940/3100/3220 which are previous highs.
 PAX( Chart: Daily Resistance: 14.25/15/16/17.50 Support: 10/10.75/12)
On a bearish market, RSI goes way below the oversold level of 30. This somehow got my curiosity to find the stock that has the lowest RSI to date which eventually led me to PAX. The RSI of this stock is currently at 6.69, the lowest of all stocks actively traded. On further observation of the price movement, this stock also has a couple of other stories to tell. The prominent things I’ve noticed on this stock are the gaps. If my analysis is correct, the price movement may have formed a break away gap, runaway gap and an exhaustion gap. The exhaustion gap coupled with the RSI is somehow telling us that selling momentum for this stock maybe near its end. What may happen in the week to come is the probable formation of an island reversal or probably a short upward move then a sideways movement. Expect heavy resistance at those levels where the gaps were made. This can be a candidate for range trading. If you could get this stock at 12, you can sell at 14 for a 15% net profit. Cutloss is at 11.50. Word of caution, even though there are signs telling us of possible end of the selling momentum, there is still a possibility that price may further move down. Next support levels are 10/10.75. The price 10.75 is the support line connecting the troughs of 2003 and 2005. While 10 is a logical support and previous low.
 JFC ( Chart: Daily Resistance: 50/51/54 Support: 44/42.50/39)
JFC may be forming positive divergence. Both the RSI and MACD are registering higher lows, while the price is registering lower lows. The positive divergence is not yet confirmed as price still has to form the trough. At this point, the price may further register lower low and may drag both the RSI and MACD with it thereby invalidating the positive divergence. However, even if the positive divergence is confirmed it may take a while before the stock starts to move the opposite direction.
 DGTL (Chart: Daily Resistance: 1.20/1.40 Support: 1.10/1.02/0.88)
DGTL is also showing signs of positive divergence. Both RSI and MACD are registering higher low while price is registering lower low. The divergence is still not confirmed as the trough still has to be formed and price may still move further down dragging the RSI and MACD and invalidating the positive divergence. Price at 1.10 is a support level, this is the support line connecting the troughs from 2002, 2003, 2004 and 2006. It’s a wait and see this week if that support line will hold.
Sunday, June 24, 2007
In Retrospect: DGTL, TBGI, ELI
DGTL
DGTL broke out of the triangle but with insufficient volume in my opinion. Price went up to as high as 1.72 before moving sideways for 3 trading days. I have redrawn the triangle and its target price is increased to 2.16. The succeeding trading days needs to be observed as volume may come in if the 130 Moving average is broken, that is if the price continues to move upward. But it seems that for the moment, it will either move down to sideways for this week.
TBGI
TBGI immediately reached the 4.15 target price and went beyond it. Expect a side to downward movement for a short correction.
ELI
ELI is still a buy. Target price of 1.12 is not yet reached. A couple if important things to note: Last trading day has already covered the gap made last Feb sell down and volume for that day was also high, which makes this a very good buy.
Sunday, June 17, 2007
StockWatch (June 18-22): DGTL, TBGI, ELI
 DGTL (Chart: Daily Resistance: 1.60/1.90 Support 1.50/1.52 )
DGTL is still in my watch list as it has not yet broken out of the triangle. Divergence is still intact and it has formed a strong support at 1.50/1.52. If triangle is broken, target price is 2.06. Looking at the bigger picture, the current triangle seems to be part of a cup and handle formation. Target price of the cup and handle formation is 3.22. This is still a very good buy considering the cup and handle formation.
 TBGI ( Chart: Daily Resistance: 2.90 /3.35 Support: 2.42/2.22)
TBGI broke out of a symmetrical triangle. Target price is 4.15.
 ELI (Chart: Daily Resistance: 0.88/0.92 Support: 0.83)
ELI broke out of the symmetrical triangle. Target price is 1.12. However price at 0.88 is a strong resistance as the price opened and closed at the same level on the day it broke out. This is probably due to those who are stuck at that level last March and April.
In Retrospect: MRC, IPVG, DGTL
MRC
Target price is not yet reached. Price is currently inching its way up with sufficient volume. The upward move is always accompanied with volume, while downward moves have little volume. At current level this is still a good buy.
IPVG
Sign of divergence of Price against RSI was invalidated during the week as RSI followed the price movement, creating lower lows. At this point, IPVG is a buy based on RSI. But expect that the upward move might only be a short term correction from the downward movement.
DGTL
DGTL went to as low as 1.50. Divergence is still intact. Stock at 1.52 seems to be a good support. This is still a buy.
Sunday, June 10, 2007
StockWatch ( June 11-15) : IPVG, MRC, DGTL

IPVG is possibly exhibiting signs of divergence of RSI against price. Price currently has formed a lower low, but RSI may be forming a higher low. Price may still move down or sideways. If price moves sideways and establishes a support at 6.30, this might be a good price level to buy. If MACD crossed above signal line, coupled with the divergence in RSI and Price is also a good signal to buy.
 MRC( Chart: Daily Resistance: 0.89/0.93/0.97 Support: 0.82/0.76)
MRC broke out from a symmetrical triangle. Volume is sufficient for a break out, but it needs to pickup more volume for it to have a strong move upward. Target price is 1.40. Buy near 0.82
 DGTL ( Chart: Daily Resistance: 1.60 Support: 1.52)
DGTL is showing signs of divergence. Both RSI and MACD might be forming a higher low, while price formed a lower low. If price continues to establish support at 1.52, this would be a good buy level. There is also a falling wedge pattern forming with a target price of 2.1
Monday, April 23, 2007
In Retrospect: IPVG, SM, DGTL
IPVG
Support at 6.40 held only up to Wednesday’s trading and went down to 6.30. But on the last trading day, price went back up. As of current, the ascending triangle is still intact. We still have the coming week to see if the dip to 6.30 was just temporary or if resistance at 7.10 will be broken this week. Recommendation: Hold. If price proceeds to move up, watch the volume at 7.10. Breakout volume should be more than 10M shares traded.
SM
SM broke down from the support line and went as low as 347.50, below the 65 day MA. Recommendation: Buy only on breakout. Although the ascending triangle is still intact, there is still a possibility that price would just move in a range between 347 and 375.
DGTL
DGTL broke out without volume. Price action did not even reach 1.90 as the 65 day MA already blocked its move up. Recommendation: Sell. There is a higher possibility of price to still move downwards.
Sunday, April 15, 2007
StockWatch (April 16-20, 2007): IPVG, SM, DGTL
 IPVG(Chart: Daily Resistance: 7.10 Support: 6.40)
IPVG seems to be forming an ascending triangle with resistance at 7.10. Target price for this ascending triangle is 9.10. Recommendation: Watch out if price continues to move down. Buy if the support at 6.40 holds.
 SM (Chart: Daily Resistance: 375 Support: 360)
SM is forming an ascending triangle with TP at 425. Recommendation: Buy only on breakout at 380, cut loss at 370.
 DGTL (Chart: Daily Resistance: 1.76 Support: 1.70)
DGTL is forming an ascending triangle with resistance at 1.76. Target price is 1.96. If it breaks out, it needs to take out the 65 day MA and the gap down at 1.90. Recommendation: Buy on breakout. Watch out for resistance at 1.90 if it breaks out without volume.