

MERB (Chart: Daily Resistance: 33 Support: 30 )
The stock is forming an ascending triangle with resistance at 33 and a possible upside of P5. But currently it is also trading within an upward channel. At this point, the ascending triangle is still in its early formation and the volume is not yet confirming the formation. If the ascending triangle is invalidated, we may just see a continuation of the upward channel with resistance at 34.
PCOR (Chart: Daily Resistance: 4.20 Support: 4.10)
PCOR has already broken out of the symmetrical triangle, the breakout volume was sufficient enough but not convincing, and the 260-day MA is currently blocking the price from going up. PCOR needs a little more push. Hopefully more volume would kick in the following days and that the support would hold.
PLTL
Previously I was expecting this stock to go down anytime, but it looks like traders are bullish with this stock and kept on buying it up to 5.30. As of current, MACD has turned from bad to good. Maybe we could expect more from this stock, but we don’t know up until when this upward trend will last. Better keep an eye on the MACD.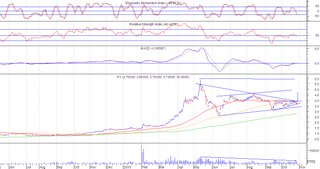
PX( Chart: Daily Resistance: 3.95/4.0 Support: 3.70/3.40)
The small ascending triangle previously noted is still intact. Hopefully the support holds
Search Google

Sunday, October 29, 2006
StockWatch (Oct 30-Nov 3, 2006) MERB, PCOR, PLTL, PX
Sunday, October 22, 2006
StockWatch (Oct 23-26, 2006) PSEi, PCOR, FLI, PLTL, PX, AT
 PSEi
PSEi
It is just interesting to note that as of last Friday, the PSEi has already gone past the previous high since last May’s Bull Run. Some stocks are also exhibiting signs of reaching their previous highs last May.
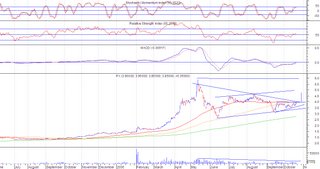
 PCOR(Chart: Daily Resistance: 4.10 Support: 3.90)
The symmetrical triangle is still intact. Price is now nearing resistance and currently the 65 day MA is providing support. Again, hopefully the pattern stays intact within the week and the price breaks the resistance. Otherwise if the consolidation is prolonged, the pattern may be invalidated

FLI ( Chart: Daily Resistance: 1.70 Support: 1.60)
FLI is forming a small ascending triangle. Though the possible upside from the pattern is small (just 0.10), it may be an indication that it might be able to reach the previous high of 1.90 last May

PLTL (Chart: Daily Resistance: 5.00 Support: 4.80)
PLTL’s previous rising wedge pattern has been invalidated by the new highs last Monday and Tuesday. From a rising wedge, it has now transformed into an upward channel. But, even if it has changed pattern, the MACD is still in a bearish stance and the higher highs generated by the previous trading days has created a confirmation of the divergence of price from the RSI and MACD
PX seems to be forming a big symmetrical triangle or just an upward channel. From within that big pattern, you can also see a small ascending triangle extending from Sept to Oct with resistance at 3.95. If the small ascending triangle is broken with volume, probably above 15M shares traded, it would have an upside target of 4.75.

AT (Chart: Daily Resistance: 8.50 Support: 8.20)
AT’s falling wedge has been broken in the last 2 days trading of the previous week. The volume on the breakout point is significant, but I think it is lacking. I was looking forward to a volume of above 3M shares traded for the break out point, but it did not materialize. The lacking volume on the breakout point was further confirmed by a low volume on the next trading day. From 2M, volume went down to 200T shares. With this kind of lethargic volume, I am inclined to think that the current price may test the support. Hopefully, if the support is tested and the price succeeds to remain above support and MA line, volume would come in to propel the price to the 9.50 possible target. As of current, I don’t think that would be achieved if the volume does not pickup.
Sunday, October 15, 2006
StockWatch (Oct 16-20, 2006) PCOR, PLTL, AT
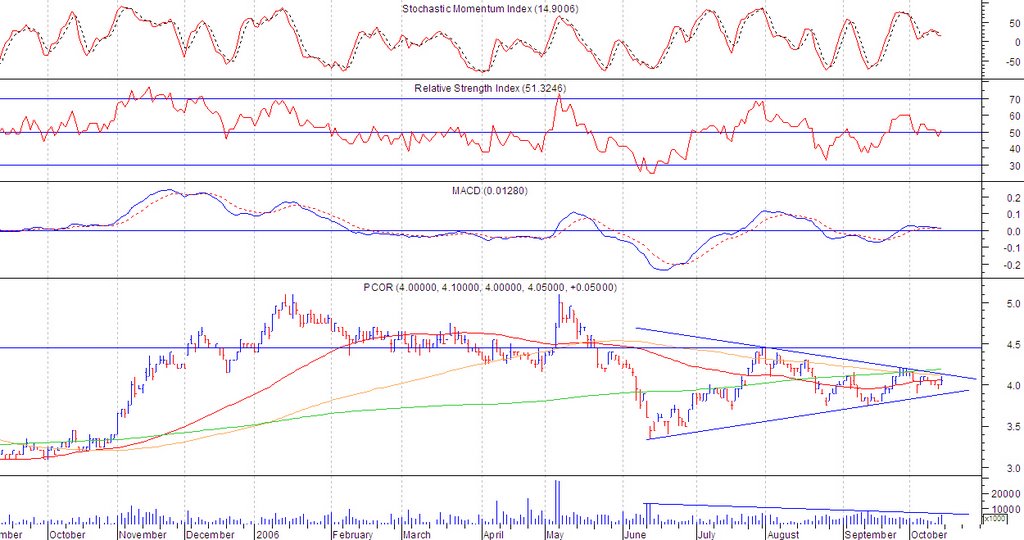
PCOR (Chart: Daily Resistance: 4.10 Support: 3.90)
PCOR’s symmetrical triangle formation is still intact. If the resistance is broken, we can expect a target price of 5.10, which is also the previous high last May. But since this is a symmetrical triangle, there is also a possibility of break down. Cut loss immediately if 3.90 is broken.

PLTL (Chart: Daily Resistance: 4.90 Support: 4.60)
Looks like PLTL is showing some bearish characteristics and may indicate that the upward trend may be nearing its end. First obvious sign is the rising wedge. A rising wedge is generally a bearish pattern, and if found at an upward trend, indicates the upward trend to be nearing its end. Second sign is the MACD crossing below signal line. Take profit on rally.
AT (Chart: Daily Resistance: 7.90 Support: 7.70/7.60/7.50)
AT is currently re-testing the support line from June 2005. This stock has previously broken that support line but was able to recover during the middle of June 2006. But before the 2005 support line is challenged, it has to challenge a couple of support levels: the 130 day MA and the support line from a big triangle (green), both converging at the 7.70 price level. Im guessing (just a guess) that price may move further down to 7.60, the 2005 support line. What I am hopeful about is the currently forming falling wedge, which if the price breaks out from, may see a potential upward movement to 9.50.
Monday, October 09, 2006
Stock Watch (Oct 9-13, 2006) PCOR
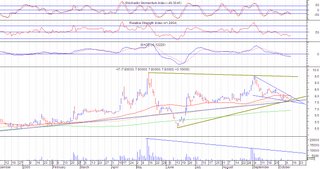
 PCOR (Chart: Daily Resistance: 4.16 Support: 3.85)
PCOR is forming a symmetrical triangle. I earlier commented that this stock has a negative outlook as the sell down from Sept 5-14 was accompanied by substantial volume, the MACD was below zero line and signal line. But currently, volume is also substantial in the upward movement and the MACD has crossed above zero line which now implies a positive outlook. The recent increase in trading volume suggests that this stock has caught the attention of some traders. If resistance is broken with volume, a possibility of near 1 peso increase in price.


