PSEi (Chart: Daily Resistance: 4413 Support: 4347/4273)
The index amazingly had another short bullish run, something which I did not expect at all to occur. The first trading day was good as we saw a white candle with value turnover that is relatively larger than the other white candles. However, the last trading day I believe is a bad sign, as an engulfing pattern was created. The black candle formed is longer than the previous candle and it just wiped out gains from the previous trading days. Not only that, large value turnover is also evident on the last trading day. For next week, expect the index to move downwards. LCB (Chart: Daily Resistance: 0.50 Support: 0.36)
Support at 0.36 for LCB did hold last week, with the stock bouncing from the lows. There is probably a renewed interest for this stock as the last trading day had a relatively large volume compared to the past 2 weeks. Observe if by Monday, the volume still increases, if it does, then we probably have a breakout of a downward channel with a target price of 0.5.
Search Google

Friday, November 05, 2010
StockWatch (Nov 08-12, 2010): PSEi, LCB

Monday, November 01, 2010
StockWatch (Nov 1-5, 2010): PSEi, LCB, CPM
 PSEi (Chart: Daily Resistance: 4299 Support: 4250)
The index moved downward to sideways last week. The MACD is still bearish and RSI is still overbought, there is still no good indication in the chart so expect further downward to sideways movement for the index next week
 LCB (Chart: Daily Resistance: 0.42 /0.75 Support: 0.36)
LC B is about to reach a support level at 0.36, the upper level of the gap up that happened last September and at the same time the 65 day MA level. The index has been moving downwards since Sep and it is now near oversold level. A bounce will definitely happen for this stock, so be on the look out for reversal formations.
 CPM (Chart: Daily Resistance: 2.55 Support: 2.06)
Sunday, September 26, 2010
StockWatch (Sep 27 – Oct 1, 2010): PSEi, LCB
 PSEi (Chart :Daily Resistance: 4125 Support: 4023/3900)
The index has continued to move sideways last week. We might be seeing the index move in between 3900 to 4125 before it once again move upward. Expect the sideways to downward action until probably when the RSI reaches near 50 to 60 level. For those going for long term, this is an opportunity to buy the dips, while for those whose objective is short term, this would be a time to lighten your load and take advantage of a possible ranging action by the index.
 LCB (Chart :Daily Resistance: 0.75 Support: 0.6 /0.43)
Sunday, July 19, 2009
StockWatch (Jul 20-24, 2009): PSEi, LC/LCB, PX
 PSEi (Chart: Daily Resistance: 2560 – 2626 Support: 2500)
Looks like this is it, the long awaited break of the resistance line formed from Oct 2007 is just one step away and based on the large value turn over and the gap that formed last week, there is a higher chance that this time, the break above the resistance line will push through.
However, the market is near overbought level again, and the most likely scenario that I could see is that the index would break the resistance and do a return move to 2560 to test the resistance-turned-support level. Also up ahead is another resistance at 2626 which is the previous high. If the market also breaks above the previous high, this definitely means were back on the upward trend for the market. LCB (Chart: Daily Resistance: 0.29/0.34 Support: 0.225/0.155)
LC and LCB seems to have broken from a sideways channel. One could also say that it has broken from a symmetrical triangle. But any which way you look at it, target price is both at around 0.32.
This stock had a shaky run with the stock being sold down on Wed last week with large volume, possibly by those who were observing the resistance at 0.235. But this was bought back up beyond the resistance, to the high of 0.25 and closing at 0.245 with ¾ of the volume during the sell down. I believe that the large volume on the following day after the sell down, neutralizes the effect of the sell down, which means a lot are still confident with this stock.
This stock is definitely a buy, but do watch out for the upcoming resistance at 0.29 and 0.34 which are previous highs. Also the stock is near overbought so do watch out for a return move towards the support line of 0.235
 PX (Chart: Daily Resistance: 7.90 Support: 6)
PX is exhibiting 2 formations, cup and handle formation and also a possible double top formation.
The bullish side of the formation, the cup and handle, has a breakout price at 8.00 with a possible target price of 11.50. A good volume on breakout is around 20M shares traded.
The bearish side, the double top, is still too early to confirm, but if the resistance at 7.90 holds, then do watch out if the stock would break the neckline of the double top at 6.00.
For this stock, it would be best to buy only on break of resistance at 7.90 and watch for the volume, there has to be large volume on breakout preferrably around 20M shares traded
Sunday, July 13, 2008
StockWatch (Jul 14-18, 2008) : PSEi, ISM, LCB, PA, BSC
 PSEi (Chart: Daily Resistance: 2500/2650 Support: 2330/2290)
The index had a good rally that lasted 3 days before succumbing to selling activities. There are a couple of things worth noting on the action last week, first is the closing of the gap down that happened last Jul 3 (Gap 2) on the first day of trading last week. It indicated strength in the upward move as it was able to go past the gap down area. Second is the nearly closing of yet another gap down on June 27 (Gap 1), on the third day of trading. It would have been good indication, if on the fourth day of trading, that the index totally closed the gap and created a new high. However, the index was sold down for that day, leaving the gap unclosed, which indicates weakness in the index. Last Friday saw the index move further down nearly closing the gap created in the rally (Gap 3). And looking from the RSI, it is near the 50 line which indicates resistance. An RSI of 50 is already considered as a resistance if the trend of the index is bearish. With that it is possible that on the first trading day next week, we may see the gap up be totally closed. What I can see as a good indication in the chart is that the RSI has now created a new higher high. In a severely bearish market, an RSI of 30 and 50 are considered areas of resistance. In previous instances, RSI was able to move beyond 30 RSI but is unable to create a new high. For last week’s case, RSI was able to move above 30 and create a new high. This is good indication, because it means RSI 30 has been eliminated as an area of resistance and can now possibly act as an area of support. So for the coming week, expect that the index would still continue to move further down, but expect that when the RSI reaches near 30, there might be support at that price level (possibly at 2330). Trading strategy is still to keep liquid. Any small amount of profit should be protected from a bearish market. Still no signs of reversal, but hopefully if the support at 2330/2290 holds, then we might see a reprieve from the bearish market and move to a consolidation phase.
 ISM (Chart: Daily Resistance: 0.039-0.040 Support: 0.033/0.029)
ISM had a good run last week, from the low of 0.026, the stock sky rocketed to 0.039, a 50% increase in price. It is also worth noting that the price also broke above 3 moving averages, and the break was accompanied by large volume, a sign that the sky rocketing action has credibility and is not just some result of speculations. Aside from breaking the 3 moving averages, the stock also broke a resistance line from Jun 2007, which is part of what seems like a falling wedge formation, with a target price of nearly 0.06. However, the stock is very much overbought as the RSI is now above 80. Aside from being overbought, the stock is also facing resistance at around 0.040, which is a support line turned resistance from 2003. For now if you have this stock, sell for the mean time. If you plan to get into this stock, a good entry would be at 0.035 and 0.33. Watch out if the stock falls further below 0.33, there might be signs of weakness of such case happens.
 LCB (Chart: Daily Resistance: 0.26/0.34 Support: 0.22)
LCB is showing some activity. Last Friday’s trading saw the stock moving higher with above average volume. It may or may not mean something, but it is worth watching as support at 0.22 held, which is a previous low. Current resistance is at 0.26, which is the start of the previous gap down.
 PA (Chart: Daily Resistance: 0.13 Support: 0.07)
PA had a promising run up to Thursday, but things went the other way around come Friday. Large volume accompanied the break out from a falling wedge, but a larger volume accompanied the sell down last Friday. This definitely is a sign of weakness, so it is better to avoid this stock.
 BSC (Chart: Daily Resistance: 0.23 Support: 0.16)
There seems to be some activity in BSC as the stock traded with large volume last Friday. Thing to watch out for this stock is its resistance line at 0.23, which if broken may give the possibility of it going to as high as 0.40.
Sunday, April 13, 2008
StockWatch (Apr 14-18, 2008): PSEi, LCB
 PSEi (Chart: Daily Resistance: 3050 Support: 2880/2870/ 2770)
The index dropped to as low as 2931 last week and retraced more than 38.2% of its rally the previous weeks. Some positive things to note, the index is still above the support line of Feb 2008 and MACD is still above the signal line. What we want to hopefully see is the MACD to oscillate near the zero line, while RSI to oscillate near the 50 level. Otherwise if MACD went lower than its recent low and RSI brokedown from the 30 level, then this is a signal that the downtrend is likely to continue. Next support for the index is at 2880-2870, which is also the 61.8% retracement. With the US market again closing lower last Friday amidst further recession jitters, the PSEi will most likely follow its move this coming week.
 LCB (Chart: Daily Resistance: 0.39 Support: 0.30)
LCB is showing signs of a bullish divergence, both RSI and MACD forming a higher low, while price forming a lower low. What’s also good to note about LCB is that the MACD is oscillating near center line. Hopefully, it would be able to move above the center line. Aside from those, there is also a possibility of an inverse head and shoulder formation, the left shoulder and head already formed, while the trough of the right shoulder is still being formed. We can confirm if this is a valid inverse h&s formation if it is able to break 0.39 with volume. As of now, it is better to just observe the stock.
Monday, November 19, 2007
In Retrospect: LCB, APXB, PEP, JFC
LCB
LCB has proven its bullishness. It was able to move past 0.50 resistance level and continued up to as high as 0.60. MACD also followed as well with the movement of the price. This stock is now over bought and may move down to sideways for the coming week. If we consider the downward channel where it broke out from, the target price is near 0.65. It is possible that a flag/pennant may form for the coming week.
APXB
APXB was not able to move up at par with LCB’s bullishness. Currently the MACD is in the position of forming a bearish divergence, but this is still not final. Any further downward move will definitely seal the bearish divergence. However, looking at the recent trading days, the upward move by this stock has volume, though it may not be as large as the breakout volume, but this is definitely a bullish sign. So I’m more inclined to see the MACD forming a higher high. Considering the downward channel it brokeout from, the target price of the stock is near 8.50.
PEP
PEP went as low as 0.78 and made a large bounce reaching the target price of 1.10 within one day. Watchout for a flag to form. There may still be some play left for this stock considering that there was only 1 day where there was a sell down. But this is left to be proven by next week. If the stock is bought up with volume of around above 10M, there is still momentum for this stock. If the stock is sold down below 0.90 with high volume, then this means the play is over.
JFC
JFC went to as low as 44.50 and went to as high as 50. As of current there is strong resistance at 50. The downward trend for this stock is still intact. Movement for this week may either be up to sideward. There is still resistance at 55. Watch out for the possible formation and break out of an inverted H&S.
Monday, November 12, 2007
StockWatch (Nov 12-16, 2007): PSEi, LCB, APXB, PEP, JFC
 PSEi (Chart: Daily Resistance: 3800 Support: 3650/3620/3520)
The index suffered another plunge last Thursday following after the Dow 200 points plunge. As of last Friday Dow took yet another 200 pts plunge after other financial institutions have also started to announce their losses from the Subprime crisis. This recent plunge will definitely be felt this week in our index. As of current we are seeing a bearish divergence forming with the RSI, however, this is still not confirmed as the trough has not yet formed. The symmetrical triangle I have noted before is still intact after the plunge last Thursday and I expect that this will be broken come Monday. Next support levels are 3650 (23.6% Fib retracement), 3620 (previous low) and 3520 (previous low of the gap up last Sept and at the same time, the 38.2% fib retracement). Aside from the above mentioned support levels, another thing to watch out is the MACD crossing below the center line. If this happens, then we may see further downward movement.
 LCB(Chart: Daily Resistance: 0.50 Support: 0.42)
 APXB (Chart: Daily Resistance: 7 Support: 6.30)
 PEP (Chart: Daily Resistance: 0.94 /0.98 Support: 0.75/0.72)
 JFC (Chart: Daily Resistance: 51 Support: 47)
JFC is a candidate for range trading. Price level at 47 is a support level and may expect a bounce from that level as RSI below 30 is very much oversold right now. Entry at 47, sell at 50, cutloss at 46.50.
Sunday, March 04, 2007
In Retrospect : PX, LCB, TBGI
PX
Affected by the global sell off, PX went to as low as 3.85. Price may move further down or sidewards for the coming week. Immediate support level is at P4 level, which is also the 65 day moving overage. A move below the P4 support may indicate that the sell off is not yet finished. Next support level is at 3.90.
LCB
This stock went up for another day before encountering a resistance at 0.42, a day before the sell off. But LCB has had better luck than the other stocks during the sell off as the price did not plunge very deep. As of current, the stock seems to be undecided and has currently formed a neutral ground at 0.35. Next support is at 0.32. Price may still move down or sideward for the week. This stock still has the potential to move up, just watch the volume.
TBGI
This stock started a sell off earlier than the global sell off. The volume on the first trading day of the week was big, which suggests that there was an almost equivalent change of hands for this stock. There were more traders who bought downward than those who bought on the up move. Volume on the succeeding days were very little compared to the first day, which also suggests that there were a lot of traders still stuck due to the global sell off. Currently the 2.30 level, which is also the 130 day moving average provides support for this stock. As long as the 2.30 support level holds, there is still a bigger chance for this stock to move up. Although a couple of sell offs might happen as it moves up as other traders who got stuck might want to get out.
Sunday, November 12, 2006
StockWatch (Nov 13-17, 2006) Mining Index, LCB, APXB, PX, MEG, JGS

Just something to note: The mining index registered an unusual increase in volume last Friday. The index gapped up with high volume, which indicates that traders have started coming in. We may see mining stocks having their day in this bullish market.

LCB picked up in volume lately. No pattern has emerged, except for an upward channel. But with the pickup in volume, and the mining index picking up, we could hope that LCB would ride with the wave towards the long term resistance at 0.45 level.
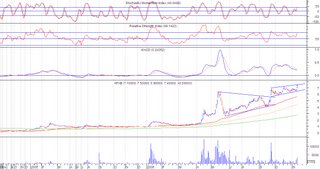 APXB ( Chart: Daily Resistance: 7.50 Support: 6.50)
Interesting to note: APXB gapped up with volume. High possibility of upward movement to break the resistance as MACD positioning to cross above the signal line. Although RSI might be oversold, seeing previous RSI levels may indicate that a move beyond the oversold level is a possibility. Hopefully APXB (and APX) could also ride the mining wave.
 PX ( Chart: Daily Resistance: 5.00/5.50 Support: 4.30/4.00)
Interesting to note: PX gapped up and broke out from a short term resistance line of 4.30. The increase in volume hopefully would bring the price up to its previous high of 5.90
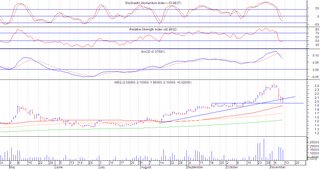 MEG( Chart: Daily Resistance: 2.44 Support: 1.96)
MEG has had a bearish move recently. MACD crossed below the signal line accompanied with volume. No pattern has emerged yet, but what MEG needs is additional volume in its upward move for it to reach the previous high. If more volume does not come in, we could see a side to downward move. For now, a bounce from the support might be forthcoming.

JGS ( Chart : Daily Resistance: 8.10 Support: 7.90/7.40)
JGS has formed a rounding bottom pattern, with the characteristics of high volume activity on the sides of the pattern. But recent price movements have somehow started to invalidate the pattern as no high volume came to break the resistance and the price continued its sideward movement. RSI is currently oversold and MACD has crossed below signal line, which might indicate an up coming move downwards. For now it would be best to take profit and possibly pick it up later.
Monday, July 17, 2006
StockWatch (July 17-21, 2006) ALI, BPI, LCB
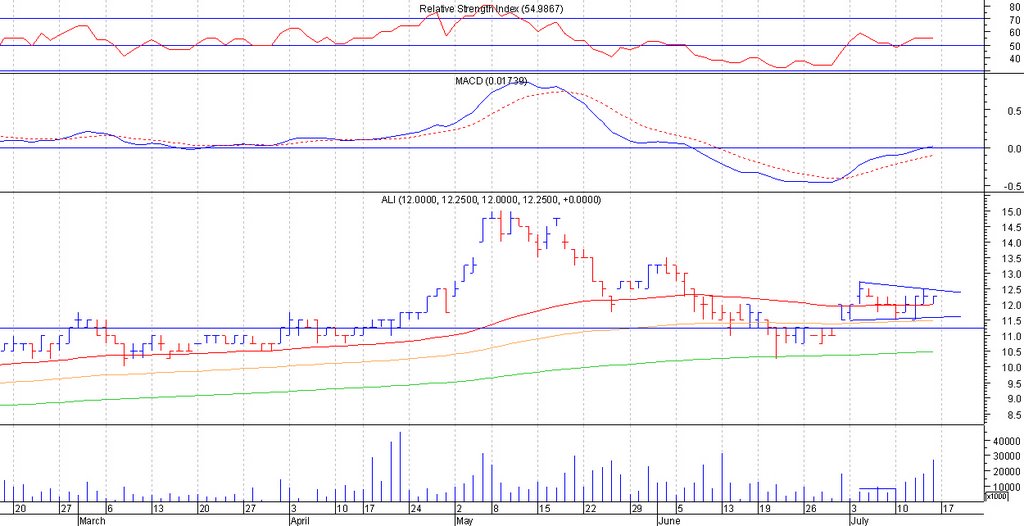
ALI (Chart : Daily ** Resistance: 12.50 ** Support: 11.75-12)
ALI is trading in a symmetrical triangle, but there is no diminishing volume. What I actually noticed is the increasing volume in the last 4 trading days. The increase in volume seems to have given a strong support at the 12 price level. If the increase in volume continues, supply at 12 level may be exhausted and we might see an upward price movement up to 13 level, the immediate previous high.
BPI(Chart: Daily ** Resistance: 51** Support: 49)
If my eyes aren’t fooling me, Im actually seeing either a symmetrical triangle or an inverse H&S forming. Both patterns share the same resistance line at 51. On the conservative side, if it is really a symmetrical triangle, we can have a target price of 56. If it is really an inverse H&S we can have a target price of 62. But ofcourse we should still be on the lookout for resistance at 55 and 60 level. Get in at 51, cut loss at 50. 
LCB ( Chart: Daily ** Resistance: 0.35 ** Support: 0.32 )
LCB is forming an ascending triangle, with resistance at 0.35. Target price is 0.40. I am not just sure if the price would be able to successfully move above the 65 day EMA as price has been bouncing off the 65 day and 130 day EMA
Monday, May 15, 2006
StockWatch (May 15-19,2006) PHISIX and LC/LCB

PHISIX (Chart:Daily ** Support :2510-2515** Resistance: 2550 )
Phisix has had a very profitable bull run. But upon seeing last week’s chart, the Phisix has now started to consolidate inside a symmetrical triangle. The MACD and the 3 MA’s are still looking very good but the RSI is still above the overbought level. I expect that by this week, the Phisix would either consolidate for the week or would break above the symmetrical triangle that has formed. My bet on the Phisix is that it would still consolidate this week and then try to break the symm triangle’s resistance by end of this week or next week. Aside from the symmetrical triangle resistance we also have an immediate resistance of 2600, the highest since last week and a major resistance of 2635, which is the previous high since 1999. If the bulls become successful in breaking the symmetrical triangle’s resistance, we could expect another bull run to the 2600 level and maybe test the resistance of 2630 level before going into consolidation phase once again.
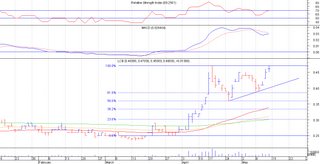
LCB (Chart:Daily ** Support: 0.40-0.41 Resistance: 0.47)
LCB as well as LC are candidates for range trading. At current it has reached the resistance at 0.47. I expect it to start its down movement this week as its RSI has reached the overbought level. If you’re going to range trade this stock, try to catch it near the support of 0.40-0.42. This stock also looks like its either forming an ascending triangle or a rising wedge.