Search Google

Custom Search

Monday, February 20, 2006

Stock Watch (Feb 18, 2006)..continuation


PCOR
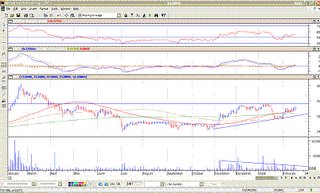
Since its break out from a horizontal movement, this stock has continued moving upwards with occasional dips. In the chart we could see that by mid January, this stock has started to move downward, but this downward movement was caught by the 65 day MA in early Feb and it has since provided support at that level. One interesting formation that can be seen in the chart is the ascending triangle. If the 65-day MA would prove to be a strong support, we might see the price move upward again and possibly break the resistance level. Current resistance is at 5.10, if resistance is broken with volume, we could see the price head to 6.20 level. Buy at 5.20 if it breaks out. If it does not get sufficient steam and starts moving downwards, cut loss at 5. But as of now, I think it would still take a couple of days before the resistance is broken.


MBT
Possibility of an ascending triangle with resistance to break at 34. Buy at 34.50-35 if it breaks out, sell if it moves down to 33.50

Saturday, February 18, 2006

Stock Watch (Feb 18, 2006)

DISCLAIMER: I am not liable for your sleepless nights should my analysis prove to be wrong and prices heads south =p

Its been a long time since I last posted a stock watch. A lot of movement occurred during the time I was away. So here's an update on the stocks.


JFC
This stock was very bullish the lst time we left off. It was trading in an upward channel on our last analysis, but now it has already gone far way off from the upward channel we last saw. From the looks of the chart, it seems the prices has now formed a descending triangleand broke down from that pattern at the price level of 38. Downward price target is at 31-32 level and has nearly been reached recently with the lowest price level at around 33. The 260 day MA is providing support and currently the price is now heading upwards again. But me thinks that the upward movement may hit a snag due to the 65 and 130 day MA plus the 38 level of resistance from which it broke down from. Support is at 33-34 level, immediate resistance at 37-38 level. Prices may consolidate for a while in between the 3 MA's


GLO
Lat time we left off of this stock, it was trying to run away from the 130 day MA. But with its price history, it has never really gone far beyond the 130 day MA. Previously after breaking the 130 day MA, this stock went tumbling down again way down below the 65 day MA. In its recent try to break the 130 day MA, it was again unsuccessful and price went down again. But this time there was something new, the price found a strong support level at the 65 day MA. With its try in breaking the 130 day MA a symmetrical traingle was formed and eventually the strong support at 65 day MA provided the launching pad for for a break out. The price broke out and has now nearly reached its target price. The recent break out had a very good price expansion. Expect a pull down of price to 780-800 price level and if the 260 day MA support level holds we may see the price to head higher

What's up with the 5GQ stock?


I left off last time with the analysis on the 5GQ(SA) stock analysis as to what is keeping the stock from appreciating. It seems that from the last time I checked there was only sideways movement with a strong resistance that formed at 0.12. But recent news has jolted the price up and back down again. As what I have said previously, this stock lacks some positive news to propel it upwards. But last Feb 9 an upward price movement happened with significant volume and expansion in price. Coincidentally it was also a day after the release of news confirming the creation of another office in Pakistan plus a good number of growing clients in Pakistan. Players might have been enticed by this news that price expanded from 0.13 to 0.14. But the sudden expansion in volume and price was not sustained long enough and a strong resistance was formed at 0.14 level. By Feb 15 the price stumbled back to 0.12 level, which was the previous resistance and now the current support level. This might have been due to the yearly report that was disclosed to the stock market last Feb 14, where in it confirmed the previous profit warning that was disclosed last Dec. Profit was down a half percent year-on-year. Just as a good news propelled the price with volume, this recent confirmation of a previously announced bad news kicked the price downwards from 0.13 to 0.12. The only positive thing about the downward price movement was that there was no significant volume. It means a lot are still holding on to their stocks and there was only a considerable few who gave up on the stock. The 0.12 price level would now act as a support price level, hopefully the price would stay above that level and if it does so, the possibility of 0.15-0.17 level is still within reach. I expect that the 2nd quarter report may be the propelling event of the stock. So hold on to your seats up until Sept for that report.