


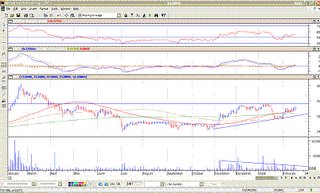
PCOR
Since its break out from a horizontal movement, this stock has continued moving upwards with occasional dips. In the chart we could see that by mid January, this stock has started to move downward, but this downward movement was caught by the 65 day MA in early Feb and it has since provided support at that level. One interesting formation that can be seen in the chart is the ascending triangle. If the 65-day MA would prove to be a strong support, we might see the price move upward again and possibly break the resistance level. Current resistance is at 5.10, if resistance is broken with volume, we could see the price head to 6.20 level. Buy at 5.20 if it breaks out. If it does not get sufficient steam and starts moving downwards, cut loss at 5. But as of now, I think it would still take a couple of days before the resistance is broken.
MBT
Possibility of an ascending triangle with resistance to break at 34. Buy at 34.50-35 if it breaks out, sell if it moves down to 33.50


No comments:
Post a Comment