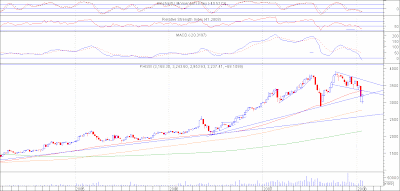
 PSEi Weekly Chart
 PSEi (Chart: Daily Resistance: 3330 Support: 2980)
The index has reached the downward TP of the channel from where it broke down. Currently an island reversal has been formed confirming the action for the past 3 trading days. The island reversal is an indication that the index is now on its way to retrace the previous action, however, this is not a guarantee that we will be out of the downward moving action. We still have a couple of resistances on the way up, one of which is the support-turned-resistance line at around 3330. Also, we have been successively gapping up for the past 3 days, forming a break away gap and a run away gap. We have yet to see an exhaustion gap, so we may see cautious trading towards the end of next week. . Looking at the MACD for the daily and weekly chart, we can see that we are still in bearish territory despite the 3 successive up days, so the appropriate strategy would be just to take short positions until probably all notable resistances are taken out.
 EEI (Chart : Daily Resistance: 2.50 Support: 2.36)
EEI looks promising as volume for the past 2 days has been exceptionally large and has the potential of retracing its previous downward move. It has currently established support at around 2.36 and has been trading sideways. However, this stock hasn’t been responding positively with the recent 3 day upward move by the index. So buying at this time is too much of a risk. A good buy signal is probably when the stock gaps up with volume of around 3M.
 TEL (Chart: Daily Resistance: 2900/3000 Support: 2740)
TEL has already reached its downward TP and has surpassed it. Currently, the trading last Friday has created an island reversal, a confirmation that the recent downward move has ended. Upcoming resistances are previous highs of 2900 and 3000.


No comments:
Post a Comment