


Mining Index
Just something to note: The mining index registered an unusual increase in volume last Friday. The index gapped up with high volume, which indicates that traders have started coming in. We may see mining stocks having their day in this bullish market.
Just something to note: The mining index registered an unusual increase in volume last Friday. The index gapped up with high volume, which indicates that traders have started coming in. We may see mining stocks having their day in this bullish market.

LCB (Chart: Daily Resistance: 0.35/0.38 Support: 0.30/0.27)
LCB picked up in volume lately. No pattern has emerged, except for an upward channel. But with the pickup in volume, and the mining index picking up, we could hope that LCB would ride with the wave towards the long term resistance at 0.45 level.
LCB picked up in volume lately. No pattern has emerged, except for an upward channel. But with the pickup in volume, and the mining index picking up, we could hope that LCB would ride with the wave towards the long term resistance at 0.45 level.
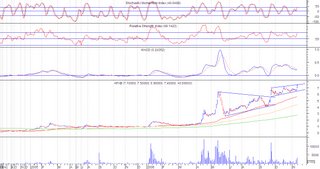 APXB ( Chart: Daily Resistance: 7.50 Support: 6.50)
Interesting to note: APXB gapped up with volume. High possibility of upward movement to break the resistance as MACD positioning to cross above the signal line. Although RSI might be oversold, seeing previous RSI levels may indicate that a move beyond the oversold level is a possibility. Hopefully APXB (and APX) could also ride the mining wave.
 PX ( Chart: Daily Resistance: 5.00/5.50 Support: 4.30/4.00)
Interesting to note: PX gapped up and broke out from a short term resistance line of 4.30. The increase in volume hopefully would bring the price up to its previous high of 5.90
 MEG( Chart: Daily Resistance: 2.44 Support: 1.96)
MEG has had a bearish move recently. MACD crossed below the signal line accompanied with volume. No pattern has emerged yet, but what MEG needs is additional volume in its upward move for it to reach the previous high. If more volume does not come in, we could see a side to downward move. For now, a bounce from the support might be forthcoming.

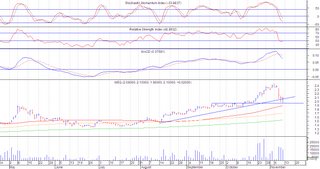
JGS ( Chart : Daily Resistance: 8.10 Support: 7.90/7.40)
JGS has formed a rounding bottom pattern, with the characteristics of high volume activity on the sides of the pattern. But recent price movements have somehow started to invalidate the pattern as no high volume came to break the resistance and the price continued its sideward movement. RSI is currently oversold and MACD has crossed below signal line, which might indicate an up coming move downwards. For now it would be best to take profit and possibly pick it up later.


No comments:
Post a Comment