
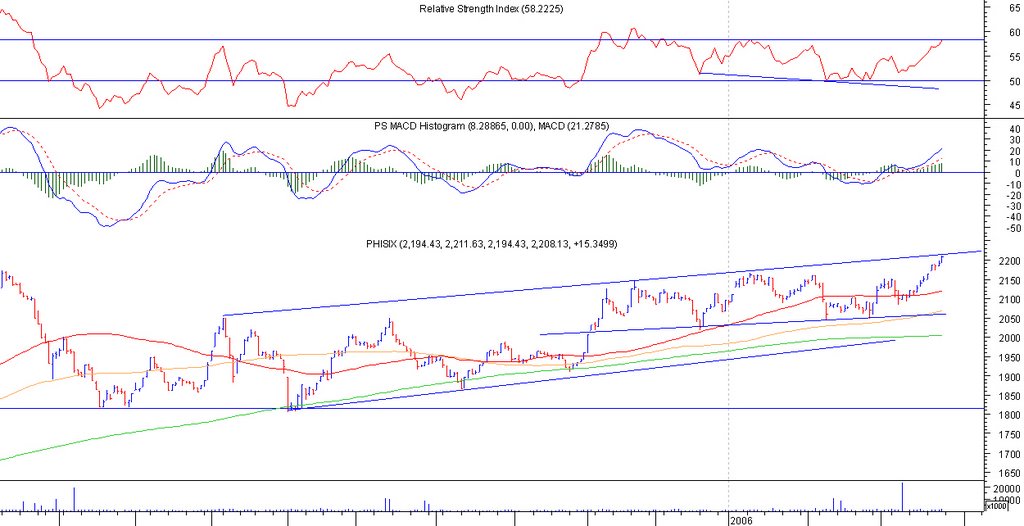
 PHISIX(Chart:Daily ** Support: 2170-2160**Resistance: 2,215)
Looks like PHISIX will try to correct by this week. We’ve had a unceasing run up for 2 weeks, and a lot of stocks has broken above their resistance lines. We may see the Phisix correct down to 2170-2160 as profit taking may take place next week. It is interesting to note that 2170 was last years high and we have already broken above it. Overall Phisix is still bullish, but a correction is due.
PCOR (Chart:Daily**Support: 4.40 ** Resistance: 4.60)
PCOR was one of the disappointments for last week. I was expecting this to take off but instead it pulled back. But not to despair there is still a future for this stock. I think we have a strong support at 4.40 as this has been the support since late Feb and as indicated by the RSI, which is about to reach the low of the month so I expect strong buying at that level. The level would be good price level to enter if you’re betting on range trading. The upward battle might be hard; we have the 65-day MA blocking the way at 4.60 and MACD is not looking good. If 4.40 do prove to be a strong support once again, the break above the 65-day MA is still a possibility. My bet, 4.40 would hold as support and by near the end of the week it may cross above the 65-day MA. 
MBT (Chart:Daily ** Support: 38/36** Resistance: 40/40.50)
Looks like MBT had a very good bull run for 2 months! That was amazing! But the alarm needs to be blown at this point. I see that the stock is now near the previous year’s resistance also during the same time period Feb-Mar. Is this a perfect example of “History repeats itself”? The MACD still looks good, but the RSI is indicating an oversold level. I couldn’t trust the MACD at this point because the previous year’s high also had a good looking MACD, but it started to dip after reaching the high. My bet is that this stock will still try to kick upward in maybe its last attempt to cash in. Then after that we may see a downward move near an immediate support of 36. A couple of disturbing patterns here, we have a rising wedge, which may dictate a price pull down to the 32 level and if it would pull down to that level, looks like were seeing a double top. Both are very bearish indicators. So take caution on this stock.
Search Google

Custom Search
Saturday, March 25, 2006
StockWatch(Mar 27 – 31, 2006) PHISIX, PCOR, MBT
Subscribe to:
Post Comments (Atom)


No comments:
Post a Comment