
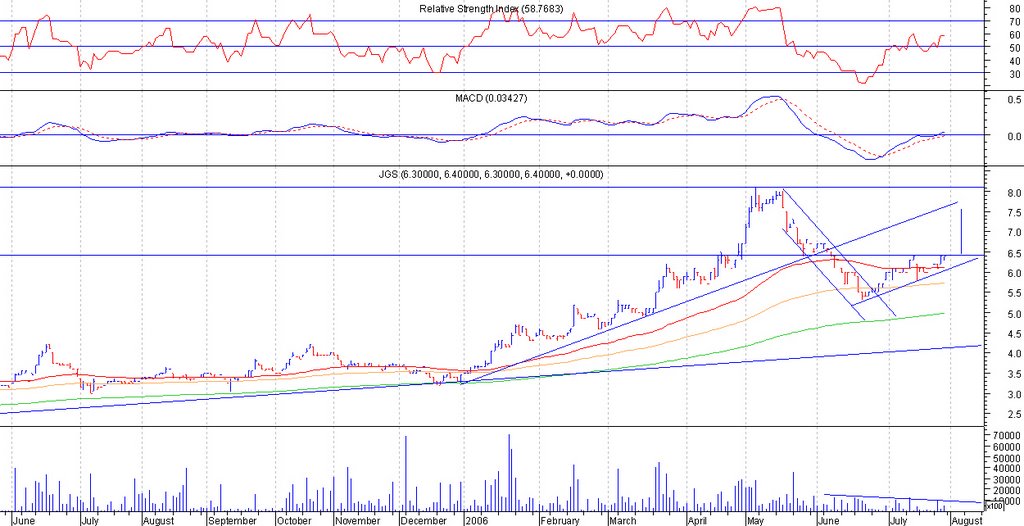
JGS (Chart: Daily ** Resistance 6.40 ** Support : 6.10)
JGS is bullish as price is above 3 MA’s and MACD is starting to move above 0. What I am seeing is an ascending triangle with resistance at 6.40. If it moves to 6.50 with volume, our target will be 7.50. Cut loss at 6.40. I would be waiting for 6.50 with volume confirmation as it may happen that the price would just consolidate and move sideways.
Search Google

Custom Search
Monday, July 31, 2006
StockWatch (Jul 31-Aug 4) JGS
Subscribe to:
Post Comments (Atom)


No comments:
Post a Comment