

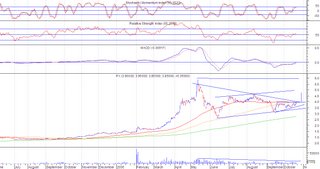
 PSEi
PSEi
It is just interesting to note that as of last Friday, the PSEi has already gone past the previous high since last May’s Bull Run. Some stocks are also exhibiting signs of reaching their previous highs last May.
 PCOR(Chart: Daily Resistance: 4.10 Support: 3.90)
The symmetrical triangle is still intact. Price is now nearing resistance and currently the 65 day MA is providing support. Again, hopefully the pattern stays intact within the week and the price breaks the resistance. Otherwise if the consolidation is prolonged, the pattern may be invalidated

FLI ( Chart: Daily Resistance: 1.70 Support: 1.60)
FLI is forming a small ascending triangle. Though the possible upside from the pattern is small (just 0.10), it may be an indication that it might be able to reach the previous high of 1.90 last May

PLTL (Chart: Daily Resistance: 5.00 Support: 4.80)
PLTL’s previous rising wedge pattern has been invalidated by the new highs last Monday and Tuesday. From a rising wedge, it has now transformed into an upward channel. But, even if it has changed pattern, the MACD is still in a bearish stance and the higher highs generated by the previous trading days has created a confirmation of the divergence of price from the RSI and MACD
PX seems to be forming a big symmetrical triangle or just an upward channel. From within that big pattern, you can also see a small ascending triangle extending from Sept to Oct with resistance at 3.95. If the small ascending triangle is broken with volume, probably above 15M shares traded, it would have an upside target of 4.75.

AT (Chart: Daily Resistance: 8.50 Support: 8.20)
AT’s falling wedge has been broken in the last 2 days trading of the previous week. The volume on the breakout point is significant, but I think it is lacking. I was looking forward to a volume of above 3M shares traded for the break out point, but it did not materialize. The lacking volume on the breakout point was further confirmed by a low volume on the next trading day. From 2M, volume went down to 200T shares. With this kind of lethargic volume, I am inclined to think that the current price may test the support. Hopefully, if the support is tested and the price succeeds to remain above support and MA line, volume would come in to propel the price to the 9.50 possible target. As of current, I don’t think that would be achieved if the volume does not pickup.


No comments:
Post a Comment