

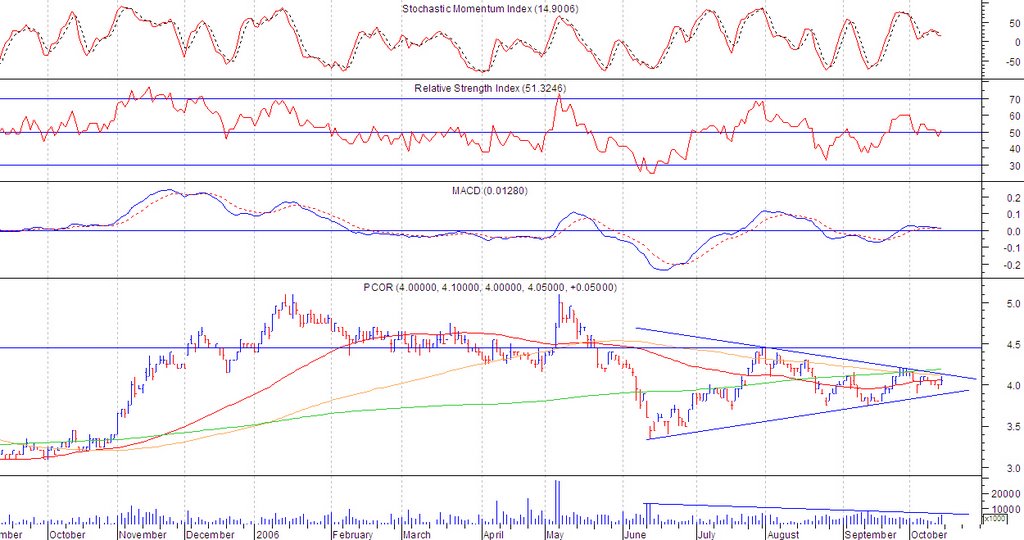
PCOR (Chart: Daily Resistance: 4.10 Support: 3.90)
PCOR’s symmetrical triangle formation is still intact. If the resistance is broken, we can expect a target price of 5.10, which is also the previous high last May. But since this is a symmetrical triangle, there is also a possibility of break down. Cut loss immediately if 3.90 is broken.

PLTL (Chart: Daily Resistance: 4.90 Support: 4.60)
Looks like PLTL is showing some bearish characteristics and may indicate that the upward trend may be nearing its end. First obvious sign is the rising wedge. A rising wedge is generally a bearish pattern, and if found at an upward trend, indicates the upward trend to be nearing its end. Second sign is the MACD crossing below signal line. Take profit on rally.
AT (Chart: Daily Resistance: 7.90 Support: 7.70/7.60/7.50)
AT is currently re-testing the support line from June 2005. This stock has previously broken that support line but was able to recover during the middle of June 2006. But before the 2005 support line is challenged, it has to challenge a couple of support levels: the 130 day MA and the support line from a big triangle (green), both converging at the 7.70 price level. Im guessing (just a guess) that price may move further down to 7.60, the 2005 support line. What I am hopeful about is the currently forming falling wedge, which if the price breaks out from, may see a potential upward movement to 9.50.


No comments:
Post a Comment