Search Google

Custom Search

Sunday, November 26, 2006

StockWatch (Nov 27-30, 2006): MEG, JFC, VUL, WPI


MEG( Chart: Daily Resistance: 2.2 Support: 1.96)

As previously noted in the Stock Watch (Nov 13-17) post, the stock was in a bearish move which was further confirmed during the past week. The bounce up was not able to cover the gap created by the downward movement and it further slid down. Currently the stock is still bearish as MACD is still on a downward movement. The movement during the 2 trading days covered the gap up created by the bounce. The stock is in the position of forming a descending triangle. If it does reach the support of 1.96, this could be a further confirmation of the descending triangle


JFC (Chart: Daily Resistance: 42.50 Support 40.50)


JFC is forming a small ascending triangle with resistance at 42.50. If resistance is broken, we could see a move towards 46. But before reaching 46, it needs to break the previous high of 44. If the ascending triangle is broken successfully, we may see price to go beyond 44. If not, then 44 may be a strong resistance


VUL( Chart: Daily Resistance: 0.98 Support: 0.83)

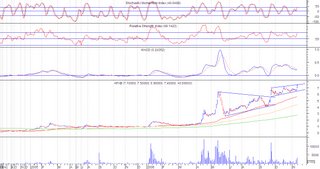
VUL is a possible candidate for a Pennant/Flag formation. The pole is already establish, just waiting for the flag/penant


WPI (Chart: Daily Resistance: 0.68 Support: 0.59)

WPI is a possible ascending triangle with resistance at 0.68. But a volume of above 18M is needed for a good break out

In Retrospect: MERB, LND, GSMI

Checking on the previous week’s analysis

MERB

MERB topped out at 37 and headed to the 35 level. Expect further move downward possibly towards 33 level. Any further move beyond 32 may be an indication of further downward to sideward movement.

LND

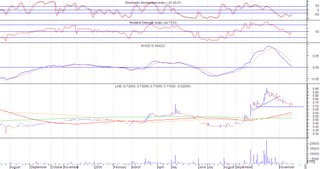
LND broke the support and moved further below 0.7. Volume is still not that great so a lot are still holding on to their stock. Next support is 0.55, previous low or 0.62 the 65 day MA.


GSMI

GSMI made another gap down with high volume. Tried to move to higher price levels (21.75) , but was not accompanied by volume so it dropped the next day. There is still a big possibility of price moving below 20

Monday, November 20, 2006

Stock Spotlight: An Electrifying Future for MERB

For most of my analysis, I’ve only concentrated on looking at the short term charts. This time around, I’ll try to get the bird’s eye view of the stock and hopefully see what future may lie upon it. The first stock I’d like to put on the spot light is MERB.

MERB Weekly Chart


The recent movement of MERB has been very bullish that it had me looking at the past as to whether this bullishness is somehow part of what kind of trend. As taught to me by the masters of absolute trading, there are only 3 ways where the stock would go, either up, down or sideways. Looking at MERB’s chart from 1992, it somehow surprised me that there really is something brewing for this stock. The downward trend from 1997 has been broken by 2003 and from then on, the stock has now started to slowly move sideways to up. A higher low has been established last May 2006 which suggest that the recent bullishness might be part of an upward trend. One thing left to confirm this upward trend is for the stock to break the 2004 resistance of 37.50 which is P0.50 away from last Friday’s price movement.

It is interesting to note that the price movement from 2003 up to current seems to be forming an ascending triangle. If the resistance at 37.50 is not broken, and the price starts to move down, this might be a confirmation of the ascending triangle, that it is still consolidating and it may take a year or two before the resistance is re-tested.

Its a wait and see for the 37.50 resistance will be broken.

StockWatch (Nov 20-24, 2006) MERB, LND, GSMI


MERB (Chart: Daily Resistance: 37.50 Support: 35/33/31)

MERB has broken an ascending triangle with volume, but not enough to characterize a good breakout. A pennant has also been formed, broken with very good volume and reached its target price. The things to look out for are the following: A. Another pennant formation. If this happens, then 37.50 resistance (previous high of 2004) can be easily broken. B. Downward movement if 37.50 is not broken. We could see a downward movement if 37.50 has not been successfully broken. Hopefully, it would just be a move towards the 35/33/31 support level. Any move further downward might result into a year long consolidation between 37.50 and 20.


LND ( Chart: Daily Resistance: 0.96 Support: 0.69 )

Interesting to note: The downward price movement is not accompanied by volume, which suggests that people are still holding on to the stock at 0.8-0.9 level. Currently price is now at 0.7 level and based on SMI we might see an upward move for this stock again.


GSMI (Chart: Daily Resistance: 21 Support: 18)

This is one stock to avoid, for now. GSMI gapped down with volume, which is a very very bearish event. Probably wait for the price to go down to 18-19 level before going in.

Sunday, November 12, 2006

StockWatch (Nov 13-17, 2006) Mining Index, LCB, APXB, PX, MEG, JGS

Mining Index

Just something to note: The mining index registered an unusual increase in volume last Friday. The index gapped up with high volume, which indicates that traders have started coming in. We may see mining stocks having their day in this bullish market.


LCB (Chart: Daily Resistance: 0.35/0.38 Support: 0.30/0.27)

LCB picked up in volume lately. No pattern has emerged, except for an upward channel. But with the pickup in volume, and the mining index picking up, we could hope that LCB would ride with the wave towards the long term resistance at 0.45 level.

APXB ( Chart: Daily Resistance: 7.50 Support: 6.50)

Interesting to note: APXB gapped up with volume. High possibility of upward movement to break the resistance as MACD positioning to cross above the signal line. Although RSI might be oversold, seeing previous RSI levels may indicate that a move beyond the oversold level is a possibility. Hopefully APXB (and APX) could also ride the mining wave.

PX ( Chart: Daily Resistance: 5.00/5.50 Support: 4.30/4.00)
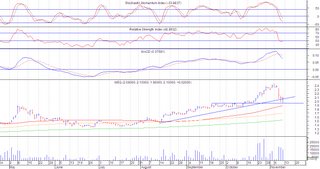
Interesting to note: PX gapped up and broke out from a short term resistance line of 4.30. The increase in volume hopefully would bring the price up to its previous high of 5.90

MEG( Chart: Daily Resistance: 2.44 Support: 1.96)

MEG has had a bearish move recently. MACD crossed below the signal line accompanied with volume. No pattern has emerged yet, but what MEG needs is additional volume in its upward move for it to reach the previous high. If more volume does not come in, we could see a side to downward move. For now, a bounce from the support might be forthcoming.


JGS ( Chart : Daily Resistance: 8.10 Support: 7.90/7.40)

JGS has formed a rounding bottom pattern, with the characteristics of high volume activity on the sides of the pattern. But recent price movements have somehow started to invalidate the pattern as no high volume came to break the resistance and the price continued its sideward movement. RSI is currently oversold and MACD has crossed below signal line, which might indicate an up coming move downwards. For now it would be best to take profit and possibly pick it up later.

Sunday, November 05, 2006

StockWatch (Nov 6-10, 2006) SMPH, JGS, PCOR, BPC

SMPH

SMPH reached its ascending triangle target of 9.50.


JGS (Chart: Daily Resistance: 8.10 Support: 7.90-7.40)

JGS has reached last May’s previous high of 8.10 and it is now testing that resistance. It is a wait and see if the resistance will be broken by the bulls. If it is broken with volume, we may see a move towards P9-10 level. A short term down movement may happen as the stock is on the oversold level and MACD is positioning to cross down the signal line.


PCOR (Chart: Daily Resistance: 4.45 Support: 4.20)

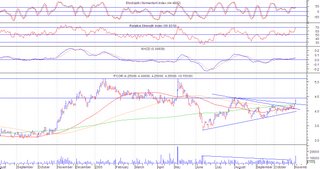
The support held after the breakout and last Friday we saw the volume pick up to 13M shares traded. The price also went above the 260 day MA. Previous high last July is now the current resistance at 4.45. Target price for this breakout is 5.10


BPC (Chart: Daily Resistance: 1.46/1.54 Support: 1.42)

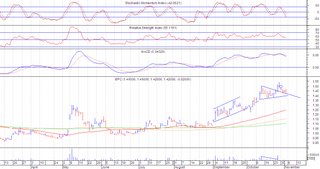
After breaking out of a small symmetrical triangle, it has started to retest the previous resistance line, which is now the support. A gap down can be noticed 2 days after the break out. If the support holds, we may see a move back up to 1.54. If the support is broken, next level of support is 1.38. But the high volume at breakout gives a higher possibility that the support would hold and the gap down be covered.