Search Google

Custom Search
Showing posts with label ALI. Show all posts

Sunday, January 10, 2010

StockWatch (Jan 11-15, 2010): PSEi, EEI, ALI, CYBR, AT

PSEi (Chart: Daily Resistance: 3077/3130 Support: 3015/2979)

First happy new year to all of you! This is my first post for the year 2010.

I was actually hoping for a stock market blast on Dec due to window dressing, but the market action last Dec was not as expected. As of current the index is still moving sideways, and previously every sideways movement comes with a short rally that would bring the index higher. That is something to watch out this time because the index moved lower last Dec and hasn’t been able to move higher than 3130, the previous high from Dec 2. If the index is able to move higher than the previous high, then good for the index, because it means there is still some steam left, but if it is unable to move beyond the previous high, we better lessen our positions as this could indicate the start of the market’s descent.

The market in general is still bullish as indicated by the RSI always pulling up when it reaches the 50 level. But for how long the index could sustain this is left unanswered.

Also another thing to watch out is the MACD crossing below the center line. As of current the MACD is still safely above the center line, with the MACD opening upward so we can probably expect further upward movement by next week. Again, since the index has been moving sideways, trading strategy would be to range trade and as much as possible avoid going long.


EEI (Chart: Daily Resistance: 2.80 Support: 2.40)

EEI had a large volume and large spread on Wed and Thursday last week. I could not see any formation, at the very least, it could have broken out of a sideways channel with a target price of above 3.0. Currently the stock has already reached 2.80, so it is not a good idea to buy at the current level. This stock had a correction on the last trading day last week, and the good news is there was not much volume on the downward movement. So this means a lot are still hoping for this stock to move higher. Try to wait for the stock to move lower near 2.50 to 2.60 level before buying. Also watch out for the volume of the downward movement. Larger volume on the downward movement means you should avoid this stock.


ALI (Chart: Daily Resistance: 12.75 Support: 10.50)

Watchout for ALI as the MACD tries to cross above the signal line and the center line as well. Trading last Friday was accompanied with a considerable large volume. The 65 day moving average is currently blocking the upward movement, but I think this will easily be surpassed by this stock. Again keep watch of the volume for signs of weakness.

Other stocks:

AT and CYBR seems to be moving with volume. CYBR is currently overbought but this can still move towards 0.75, which is a previous high. AT also had large volume last week and it can still move higher, only problem is that it is already overbought. On both stocks, you can probably wait for a return move before buying.


Sunday, August 31, 2008

StockWatch (Sept. 01-05, 2008): PSEi, MBT, ALI, AGI, PLTL

PSEi (Chart: Daily Resistance: 2740/2750/2775 Support: 2632)

Looks like we can again say “this is it!”. We have indications that good things are about to come. The island reversal pattern that is being observed was invalidated as we now have a pullback from the low of 2632. Support at RSI 50 level did hold, which indicates a bullish outlook. Stochastics is pointing to a buy indication. And most importantly, there was a good spread last Friday, a good white candle formed accompanied by with large volume! The only thing that is not pointing to a bullish outlook is the MACD still below the signal line, but on the otherhand, even if it is below the signal line, the whole MACD is still above the centerline which suggests a bullish outlook for the long term. Due to those indications, it is highly probable that we will be seeing a good run for the coming week. Upcoming resistance is within the range of 2740 to 2750, which are points in the resistance line from May to Aug 2008. The same resistance line is acting as the resistance for an Inverse Head and Shoulder formation. A break above that line with large volume is definitely a welcome event. So watch out for the resistance line. Target price for the inverse head and shoulder is around 3300 level. If the inverse head and shoulder is broken, this may be a full confirmation of the reversal of trend. Watch out for stocks that may be displaying the same signs as with the inverse head and shoulder formation.

MBT (Chart: Weekly)

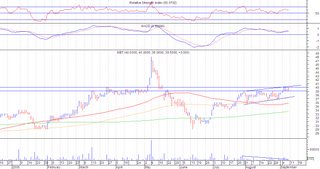
MBT (Chart: Daily Resistance: 41.50 Support: 36.50)

MBT is one of the stocks displaying similar characteristics of an inverse head and shoulder formation. Looking at the daily and weekly charts, the resistance is at 41.50 to 42 with possible target price at 52. What’s good about this stock is that the price is now above the 2 MA’s and only the 260 day MA at 45 is left which is also the same area of resistance from the downward trend line connecting the previous highs of June to Dec 2007. Trading last Friday was accompanied with large volume. Breakout may happen within 1 to 3 weeks.

ALI (Chart: Weekly)

ALI (Chart: Daily Resistance: 11.25 Support: 10)

ALI is also one of those stock exhibiting an inverse head and shoulder formation. Resistance is at 11.25 with a possible TP of around 14.50. Right shoulder is still not fully formed and may also take 1 to 3 weeks to form.

AGI (Chart: Daily Resistance: 5.5 Support: 3.80)

AGI broke out from an inverse head and shoulder formation. It is now halfway to the target price of 5.50. The stock is very bullish with the breakout having a large spread and volume. It also broke the 260 day MA. This stock is definitely a buy, but since the stock is now halfway thru the target price, caution should be exercised when getting in the stock.

PLTL (Chart: Daily Resistance: 8.60/9.90 Support: 8.40)

PLTL looks ripe for the picking, last Friday’s trading had a large volume and price at 8.40 and RSI at level 50 are holding on as support. Stochastics and the 3 MA’s are looking good and it is possible that the stock may rise for the coming week. It has a possible target price of around 10.50 to 11.00. Recommendation is buy at current price of 8.50, cutloss at 8.30.

Sunday, May 25, 2008

StockWatch (May 26-30, 2008): PSEi, ALI

PSEi (Chart: Weekly)


PSEi (Chart: Daily Resistance: 2900 Support: 2760)

The index had a very good 2 week rally which ended last week. Currently the index is seen to have gapped down last Thursday, forming a possible island reversal of the recent rally. Some points to take note: A.) The index broke above the long term resistance line from December 2007. This I think is a positive move for the index, even though the index recently created a lower low, it is now above 2 resistance line, one from Feb 2008 and the other from Dec 2007. It’s one small step at a time towards the index’s recovery. B.) The MACD is now just a few points away from crossing the center line. But the bulls would still have to fight for the right to cross the center line, as it is common during bearish market that the MACD center line usually acts as a resistance. We can expect that there will be further MACD consolidation near the center line, before it moves above. C.) Just like the center line of the MACD chart, the 50 RSI level usually acts as a resistance area during bearish market. We can expect the RSI to form a higher low this time, probably encountering support at around 30-35 RSI level. D.) Looking at the weekly chart, we can see a positive move by the MACD, which is in position to cross the signal line.

For the coming week, the index may move lower as an effect of the gap down. So it is better to lock in any gains that were made for the past 2 week’s rally. For those trading the volatility, next possible entry is when the RSI reaches 30-35 levels.

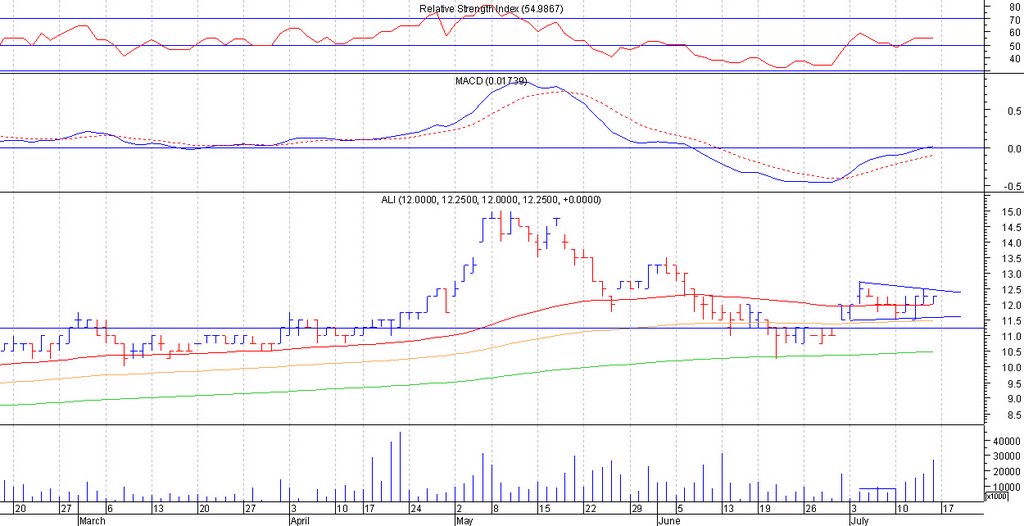
ALI (Chart: Daily Resistance: 11.50 Support: 9.50)

ALI is showing signs of a possible double bottom. The neck line of the double bottom is at 11.50. However, it seems that resistance is now being encountered even at current price level of 11. The general market sentiment is still bearish, and this double bottom that we are seeing might not materialize. But a positive thing to point out is that MACD is now above the center line and price is now above the 65 day MA. Hopefully the 65 day MA would provide support and MACD would stay above the center line.

Monday, March 17, 2008

StockWatch (Mar 17-19, 2008): PSEi

PSEi (Chart : Daily Resistance: 3000 Support: 2870)

The index went lower than the recent previous low of 2950 and proceeded to its lowest for the week at 2890. Next support is the previous low of August 2007 at 2874. Looks like a double top, but ofcourse this is still not confirmed not until the support line (which is the previous low) is broken. However, a lot of stocks are already very much oversold and badly sold down since January 2008, so there is still the possibility of a bounce from the previous low. Looking at the RSI and MACD, we can also see a possible bullish divergence. Watch out for UP days that are not accompanied with large volume. With the recent continuous downward movement of the index, as well as most of the stocks, a large volume is very much important to validate an upward move. Trading strategy would still be to stay on the sidelines, watch out for a possible bounce from the support or break of resistance line with volume. Trading for this week might be lethargic sideways movement as a lot may be on vacation mode already for the coming long weekend.

The following stocks exhibit very low RSI’s: ALI(20) , FPH(18), PNB(19), VLL(14). Watchout for possible bounce from the recent downward move, but ofcourse the low RSI does not guarantee this bounce as the price may still move lower even if RSI is already the lowest of all stocks. Look for large volume on upward movements.

Sunday, January 14, 2007

In Retrospect : MBT, KPP, ALI, FGEN

MBT
Went beyond resistance level but was unable to sustain the move above it. Last Friday’s trading day saw another effort by the bulls to push the price above resistance level. This coming week would be a wait and see if the bears still have some more strength to pull the price down. Price may move side to downward before pushing above resistance. Recommendation: Hold

KPP
The last 2 trading days was accompanied by very high volume and price went up to as high as 0.59, very much breaking the resistance. Next resistance would be 0.59-0.6. Recommendation: Hold.

ALI
Instead of providing a strong support at 15.75, it became a resistance as price went down and tried to go beyond 15.75. Though there were many sellers that sold down and cashed in at 15.25-15.75 levels , the buyers still had the upper hand as closing price was kept near opening price. Last Friday’s trading saw the resurgence of volume. Hopefully this will be the continuation of the upward move.
Recommendation: Hold

FGEN
The price did move down near support level. Price is now poised for an upward move. This is a good opportunity to capture a P3 move for the short term.Recommendation: Buy at 53-53.50 Sell at 56-56.50

Monday, January 08, 2007

StockWatch (Jan 8 – 12, 2007) MBT, KPP, ALI, FGEN

MBT (Chart: Daily Resistance: 53 Support: 49)

MBT is forming an ascending triangle with resistance at 53. If resistance is broken with volume, price can go up to 61. Recommendation: Buy near the support level, sell if it goes below support with volume.


KPP (Chart: Daily Resistance: 0.54 Support: 0.45)

KPP does not have any area pattern forming, but the unusual volume that accompanied last Friday’s trading and the MACD has brought a positive side to this stock. If the succeeding trading days will be accompanied by substantial volume of 6M and above, there will be a higher probability that this may try to reach the previous high of 0.68 Recommendation: Buy

ALI (Chart: Daily Resistance: 16/16.50/17 Support: 15.50)

Last Friday’s trading saw ALI’s volume sky rocket to 118M. This makes the 15.75-16 level a strong level of support. It also broke the ascending triangle that formed from October –December. Price may go as high as 17.50. But a couple of resistance will be encountered at 16.50 and 17 as these are previous highs. Recommendation: Buy.


FGEN (Chart: Daily Resistance: 56.50 Support: 54)

FGEN is forming an ascending triangle. A possibility of P5 move upwards. But at this point it is still to early. Price may still go near support level. Recommendation: Buy near support

Saturday, September 16, 2006

StockWatch (Sept 18-22,2006) ALI, SMPH, MAB

MAB

A possible symmetrical triangle is emerging from MAB. But at this point, im not so sure if the volume confirms it.


SMPH

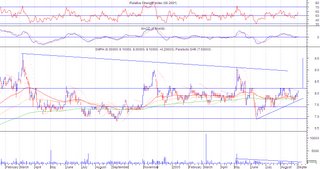
The ascending triangle is still intact with resistance at 8.20. Im expecting that this may reach 8.10-8.20 before pulling back to near support of 7.80-7.90


ALI

The ascending triangle is still intact. If it is still unable to break resistance at 14.25, this would be a confirmation that it is now on a sideways movement with a range of 13 -14.25

Sunday, September 10, 2006

StockWatch (Sept 11-15, 2006) SMPH, PCOR, PLTL, MBT, ALI


SMPH
Price is still within the ascending triangle. Hopefully the support at 7.70 holds to keep the ascending triangle intact.


PCOR

I earlier said that PCOR is an ascending triangle. On further analysis, I was wrong in assuming that it is an ascending triangle. After this week’s activity, it seems to be forming more as a symmetrical triangle, with support at 3.8 and resistance at 40.50. Considering the volume increase towards the tip of the triangle, I’m now in doubt if this is a valid symmetrical triangle. I am more inclined to consider this as a bearish move that may break the support.


PLTL

PLTL has broken out of the symmetrical triangle, but has yet to meet its target price of 4.75 because it has met a resistance at the 4.35 level. From the 4.35 level it moved back 38.2%. If the price is able to hold at the 4.10 level, we may still see a further upward move to its target price of 4.75. If not, we may see a move towards the 3.8 level the previous resistance which is now a support level


MBT

I was expecting a breakout of price from the ascending triangle formation, but apparently, the break above the 39 level resistance came without a convincing volume. The succeeding days further confirmed the false breakout. It now seems to be further consolidating into an upward channel. The immediate support is at 39 and resistance is at 40.50.


ALI

The recent price movement of ALI seems to confirm the resistance at 14.25. But after further analyzing, there are several patterns that seem to be forming. There are 2 ascending triangle forming. The first is a big ascending triangle with a target at around 17 and the second is a small ascending triangle, with a target at around 16. The third is a sideward channel. But I think the smaller ascending triangle and the horizontal channel are much more valid than the bigger ascending triangle. If the resistance is broken without volume, im expecting a slow push towards the 15 level. If it does reach that level, we may be looking at a big ascending triangle.

Tuesday, September 05, 2006

StockWatch (Sept 4-8, 2006) PCOR, ALI, GLO, SMPH


PCOR (Chart: Daily ** Resistance: 4.20/4.45 ** Support: 3.8)
PCOR seems to be forming an ascending triangle. The target for the formation is 5.50. Breakout price is at 4.50. The 3 MA’s is currently blocking the price movement, but this might be broken within the week for the price to reach the resistance at 4.45.

ALI (Chart: Daily ** Resistance: 14.25/15 ** Support: 13.50)
ALI is forming an ascending triangle with resistance at 14.25. If the resistance is broken with volume expect a target of 17.75. But before it reaches that target it also has to break the previous high of 15. If the price continues to move up with low volume, we could redraw the resistance at 15 and expect a higher target price. But for now, we just would have to wait.


GLO (Chart: Daily ** Resistance: 1080 ** Support: 980)
GLO is trading in an upward channel. There is also a symmetrical triangle formation but the volume does not confirm the pattern, so its more likely to be an upward channel. I included GLO in the list because I noticed that volume is slowly picking up. There might be something brewing in this stock.


SMPH (Chart : Daily ** Resistance: 8.20 ** Support: 7.70)
SMPH is forming an ascending triangle with resistance at 8.20. Possible upside target of 9.50. But before it reaches the target, resistance might be encountered at th 8.50 and 9 level.

Monday, July 17, 2006

StockWatch (July 17-21, 2006) ALI, BPI, LCB


ALI (Chart : Daily ** Resistance: 12.50 ** Support: 11.75-12)

ALI is trading in a symmetrical triangle, but there is no diminishing volume. What I actually noticed is the increasing volume in the last 4 trading days. The increase in volume seems to have given a strong support at the 12 price level. If the increase in volume continues, supply at 12 level may be exhausted and we might see an upward price movement up to 13 level, the immediate previous high.


BPI(Chart: Daily ** Resistance: 51** Support: 49)

If my eyes aren’t fooling me, Im actually seeing either a symmetrical triangle or an inverse H&S forming. Both patterns share the same resistance line at 51. On the conservative side, if it is really a symmetrical triangle, we can have a target price of 56. If it is really an inverse H&S we can have a target price of 62. But ofcourse we should still be on the lookout for resistance at 55 and 60 level. Get in at 51, cut loss at 50.


LCB ( Chart: Daily ** Resistance: 0.35 ** Support: 0.32 )

LCB is forming an ascending triangle, with resistance at 0.35. Target price is 0.40. I am not just sure if the price would be able to successfully move above the 65 day EMA as price has been bouncing off the 65 day and 130 day EMA