Search Google

Custom Search
Showing posts with label PLTL. Show all posts

Sunday, October 19, 2008

StockWatch (Oct 20-24, 2008) : PSEi, GLO, DGTL, PLTL

PSEi (Chart: Daily Resistance: 2176/2292 Support: 2080)

The index experienced a temporary relief during the beginning of last week, but this was capped by the resistance near 2270 and the index again fell and created a big gap. As of current, the index is still respecting the support line formed from August of 2007 connecting the trough of July 2008 and recently also connecting the last 2 week’s low. This week will be the judgement week for that support line to see if it would still hold.

There is currently a manifestation of a possible double bottom. But this double bottom may be a reversal only for the short term trend. Its neckline is at 2176, with a possible target price at around 2500. If the support line is broken, then the possible double bottom will be invalidated.
Still, there is no clear reversal for the current bear market. The MACD is still below the centerline so this means hold only for the short term. The market is still very much oversold, a lot of stocks are still below the RSI 30, so there is s higher probability of another short rally by this week.


GLO (Chart: Daily Resistance: 980 Support: 820)

GLO just recently turned very bearish as the standing support line connecting the troughs from 2002 was broken with large spread and good volume. The support line was initially tested last Sept 2008 and it stood its ground. Two weeks ago, it was again tested and broken with significant volume. The stock was able to rally for a short time and moved above the support line, but went further down last Thursday and Friday again with big spread and good volume. The break down that happened last week is further confirmation of the breakdown that happened 2 weeks ago.

The next support for this stock is at 820, which is the previous low from around June of 2006.

DGTL (Chart: Daily Resistance: 1.28 Support: 1.12/1.10)

Looks like all communications are down from the current bear market storm. DGTL, like GLO also broke down from its standing support line since 2002. The symmetrical triangle that I was previously so much hoping to breakout, went down instead. Its official, DGTL, GLO and TEL are all in the very bearish region. TEL broke its support line since June. PLTL is the only communications stock that still hasn’t broken its support line from 2003, although, it has already broken its support line from 2006. (See chart below)

Next support line for DGTL is at 1.10 which is a previous low from 2007.


PLTL (Chart: Daily Resistance: 7.40 Support:6.50)

PLTL unlike TEL,GLO and DGTL still has a long way to go before breaking the support from 2003. But it has already broken support from 2006. Compared to the other telecoms stock, I can say that PLTL still has hope amidst the bearish market, but, were still not out of the woods, so let’s further observe the movements for this stock. Next support for this stock is at 6.50 which is a previous low.

Sunday, August 31, 2008

StockWatch (Sept. 01-05, 2008): PSEi, MBT, ALI, AGI, PLTL

PSEi (Chart: Daily Resistance: 2740/2750/2775 Support: 2632)

Looks like we can again say “this is it!”. We have indications that good things are about to come. The island reversal pattern that is being observed was invalidated as we now have a pullback from the low of 2632. Support at RSI 50 level did hold, which indicates a bullish outlook. Stochastics is pointing to a buy indication. And most importantly, there was a good spread last Friday, a good white candle formed accompanied by with large volume! The only thing that is not pointing to a bullish outlook is the MACD still below the signal line, but on the otherhand, even if it is below the signal line, the whole MACD is still above the centerline which suggests a bullish outlook for the long term. Due to those indications, it is highly probable that we will be seeing a good run for the coming week. Upcoming resistance is within the range of 2740 to 2750, which are points in the resistance line from May to Aug 2008. The same resistance line is acting as the resistance for an Inverse Head and Shoulder formation. A break above that line with large volume is definitely a welcome event. So watch out for the resistance line. Target price for the inverse head and shoulder is around 3300 level. If the inverse head and shoulder is broken, this may be a full confirmation of the reversal of trend. Watch out for stocks that may be displaying the same signs as with the inverse head and shoulder formation.

MBT (Chart: Weekly)

MBT (Chart: Daily Resistance: 41.50 Support: 36.50)

MBT is one of the stocks displaying similar characteristics of an inverse head and shoulder formation. Looking at the daily and weekly charts, the resistance is at 41.50 to 42 with possible target price at 52. What’s good about this stock is that the price is now above the 2 MA’s and only the 260 day MA at 45 is left which is also the same area of resistance from the downward trend line connecting the previous highs of June to Dec 2007. Trading last Friday was accompanied with large volume. Breakout may happen within 1 to 3 weeks.

ALI (Chart: Weekly)

ALI (Chart: Daily Resistance: 11.25 Support: 10)

ALI is also one of those stock exhibiting an inverse head and shoulder formation. Resistance is at 11.25 with a possible TP of around 14.50. Right shoulder is still not fully formed and may also take 1 to 3 weeks to form.

AGI (Chart: Daily Resistance: 5.5 Support: 3.80)

AGI broke out from an inverse head and shoulder formation. It is now halfway to the target price of 5.50. The stock is very bullish with the breakout having a large spread and volume. It also broke the 260 day MA. This stock is definitely a buy, but since the stock is now halfway thru the target price, caution should be exercised when getting in the stock.

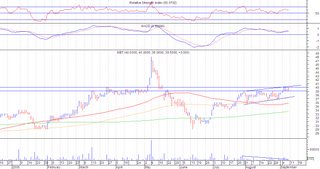
PLTL (Chart: Daily Resistance: 8.60/9.90 Support: 8.40)

PLTL looks ripe for the picking, last Friday’s trading had a large volume and price at 8.40 and RSI at level 50 are holding on as support. Stochastics and the 3 MA’s are looking good and it is possible that the stock may rise for the coming week. It has a possible target price of around 10.50 to 11.00. Recommendation is buy at current price of 8.50, cutloss at 8.30.

Monday, August 25, 2008

StockWatch (Aug 26-29, 2008): PSEi, PLTL

PSEi (Chart: Daily Resistance: 2775 Support: 2634/2615)

The index had a sell down week last week, with the index breaking support established from July. One of the possible patterns we were observing last week was an island reversal. Currently, the index is still respecting the gap that was formed on the first week of August so the possible island reversal that we are observing is still neither confirmed nor invalidated. It will be invalidated if the gap is closed or a pull up happens for this week. Also the rising wedge that we have observed and whose support was broken last week is almost near its target price of 2615, which is also a point in the support line from July. The MACD is not looking good as a cross below the signal line already happened, but on the other hand the RSI is looking better. It is possible that at RSI 50 we may experience some respite from the continuous selling action last week, because RSI 50 is sometimes a support area especially after a bullish action, which is what happened with the index for the past weeks prior to the sell down. Also looking at the volume towards the end of the trading week last week, we are seeing a decrease in volume, which is a good indication that selling action is dwindling, but it is still not an assurance that selling action will cease. So for the coming week, a cautious trading is recommended, it is still possible that the index would still move down to sideways. Watch out for 2615, if this is broken, it is best to stay on the sidelines again for the mean time. Watch out also for a possible inverse head and shoulder formation.

PLTL (Chart: Daily Resistance: 9.90 Support: 8.40/8.00)

PLTL is showing 2 patterns, one is a slightly skewed symmetrical triangle; the other is a rounding bottom pattern from Oct 2007. In both patterns, a breakout occurred with sufficient volume with a possible target price of 10.00. But looking at the chart, the target price has already been reached with the highest at 9.90. If one is to follow a strict observance of entry and exit price levels, any one who is holding this stock should have already sold near the highest price since the target price is considered to have been reached already. For those who have not yet sold their positions, I would advise to observe the support level at 8.40. If price for next week goes below the support line, sell immediately. For those who are going long for this stock, observe the same support level. If support holds, then this is a good indication for the stock. Another good indication is that the 3 MA’s are in its correct bullish position plus the MACD is now way above the center line. Aside from those, it can also be observed from this stock that we are currently in a bullish phase of the stock. (Bullish phase is characterized by the RSI always oscillating above the 50 level and MACD always oscillating above the centerline). Even if the RSI goes below the 50 level as long as it is able to pull itself back above that level, it will still be a good indication of the continuation of the bullish phase. As of current, there seem to have formed an island reversal, but this is just for the short term. For those going long on the stock and would like to keep safe, the break of support at 8.40 is a signal to sell. For those observing the Elliot wave pattern, if my analysis is correct, we are now in Wave 4, so there is still hope for this stock as Wave 5 is still not formed. Price level at 8.00 is critical for Wave 4, it must not overlap the peak of Wave 1 for it to be considered as a correct Wave 4.

For the coming week, judging from the stochastics and the RSI, there is a higher possibility of either a sideways or upward movement of price. Still, cautious trading should be observed as support level is still being tested and it still hasn’t proven its strength.

Sunday, October 21, 2007

In Retrospect: MIC, PLTL, MPI, WEB

MIC

MIC has had a hard time breaking above the 8.70 resistance level. It was able to do so once, but price fell back in consolidation for the same day. On the other hand even if it was not able to maintain a position above 8.70, price was able to maintain the support on 7.80 level. As of current, MIC is consolidating in a small sidewards channel between 7.80 and 8.70. If price continues to move below 7.80, it would be best to sell considering it has consolidated for 2 weeks and a move towards 7.80 means a stale mate has been broken between the bulls and the bears and definitely the bears win if price goes below 7.80. Next support at 7.70/7.10/6.10.

PLTL

PLTL’s price has consistently closed at or above 8.00 the previous week. It was an unexpected move for PLTL to break the support at around 7.80, bringing the price down to 7.40. It fell 10 cents short of reaching the downward target of 7.30. This is one of the rare occasions that an ascending triangle breaks down. If price would still rally by Monday, this would be a good time to sell, considering that MACD just turned bearish.

MPI

The flag/pennant formation for MPI did not materialize. Instead a spike happened on the second trading day, opening at 5.30, achieving a high of 5.80, before closing again at 5.30. Currently it has found support at 5.00, but price may still move further down or sideways movement for the coming week.

WEB

WEB is dangerously moving near the apex of the symmetrical triangle. A breakout or breakdown may happen soon. Otherwise we have to redraw our charts. As of current the 130 day MA is providing support at 0.0525. I’m more to expect a breakdown from this stock because of the following bearish indicators: 1.) the 65 day MA moving below 130 day MA, 2.) MACD crossing below the signal line. 3.) RSI has consistently stayed near oversold level. The next support levels are 0.0525/0.048/0.042

Sunday, October 14, 2007

StockWatch (Oct 15-19, 2007): MIC, PLTL, MPI, WEB

MIC (Chart: Daily Resistance: 9.20/ 10.00/ 11.50 Support: 7.80/6.50)

MIC gapped up with volume on the first trading day. Target price of P13.00 is not yet reached. Price is currently near 8.10. MIC has currently developed into a flag/pennant formation with a target price of 11.50. Support is currently at 7.80, resistance at 9.20 and 10.00.


PLTL (Chart: Daily Resistance: 8.10 Support: 7.60)

PLTL also gapped up with volume on the first trading day. Currently it is consolidating inside a small ascending triangle with a target price of around 8.60. The target price of P9.00 for the ascending triangle where it broke out from (at 7.30) is still not achieved. Getting in at this point is a little bit risky as price is in its halfway point.


MPI(Chart: Daily Resistance: 5.30/5.50/5.80 Support: 4.60/4.20)

Large volume for MPI for the last 2 trading days. This is a candidate for a flag/pennant formation.


WEB (Chart: Daily Resistance: 0.060 Support: 0.055)

WEB is currently in a symmetrical triangle. For the short term, it is consolidating inside an ascending triangle with resistance at 0.060. If it breaks out of the ascending triangle, target price is at 0.075. A breakout from the symmetrical triangle would have a conservative target price of 0.085.

Monday, October 08, 2007

In Retrospect: PLTL, ISM

PLTL

PLTL broke resistance at 7.10 but without volume. However it was able to sustain its upward move toward 7.30 and eventually also broke out from 7.30 with considerable volume. The last 3 trading days were characterized by above average volume. RSI is now oversold and there is a possibility that 7.30 support (previously resistance) will be re-tested.

ISM

I’m unsure of how ISM will fair in terms of the flag/pennant formation. Usually in the local market flag/pennant formation has a duration of 3 days for it to form. For ISM it has already taken 5 days for the formation and still no breakout. Watch out for support at 0.042, price going below that would be a signal to sell.

Sunday, September 30, 2007

StockWatch (Oct 01-10, 2007): PSEi, PLTL, ISM

PSEi (Chart: Daily Resistance: 3600-3700 Support: 3520)

We now have further confirmation of the upward move. The 65 day MA and 61.8% Fib retracement were easily taken out by a gap up with considerable volume. As of current the index is now overbought, expect side to downward movement in the index for the coming days. MACD may test the center line as support, if it is able to stay above the centerline despite the downward move this is another sign of strength for our index. We now have only 2 remaining resistance along the way to establishing a new high: the gap down and previous high formed last July. Let’s get ready to rumble!


PLTL (Chart: Daily Resistance: 7.10/7.30 Support: 6.90)

PLTL is displaying the characteristics of an ascending triangle. Two resistance points can be noted, first is at 7.10, second at 7.30. If it breaks out of 7.10, target price is around 8.70, if it breaks out of 7.30 target price is 8.90. A good breakout volume would be above 15M shares traded


ISM (Chart: Daily Resistance: 0.055 Support: 0.046)

ISM is a candidate for a flag/pennant formation. Watch out for the pennant/flag for the coming week. Conservative target price of atleast 0.07 based on the current pole.


General note: There are a lot of other stocks exhibiting ascending triangle characteristics (e.g SM, SMPH, SMDC). If the coming week will be a down to sideward move, this might be a good chance to get in those stocks, however do observe your cutloss levels if incase price moves further down.

Sunday, July 15, 2007

In Retrospect: PLTL, PAX, PA

PLTL

PLTL was very much affected by the drop in the market. The stock went back in the triangle to as low as 6.90 before being able to regain its previous high of 7.30. At this point, price may either move sideways or up to 7.50-7.70. This is still a buy.

PAX

The price movement was not as fast as I thought it would be. Price was able to move to as low as 22.50 before closing to 23.75 for the week. The target is still 25 and there is still no signs of reversal.

PA

This stock sky rocketed its way from 0.05 to as high as 0.17 within a week. Expect selling to be heavy this week. Possibility of RSI to move down near 70 before moving up again.

Sunday, July 08, 2007

StockWatch (July 09-13): PLTL, PAX, PA

PLTL (Chart: Daily Resistance: 7.30/7.50/7.70/7.90 Support: 7.10/6.90)

PLTL had a break out Wednesday last week. Target price is 8.60. High resistance might be encountered near 7.70-7.90 as that was the highest price when the Feb sell down happened. With the very good breakout volume, this is already a buy at 7.30.


PAX ( Chart: Daily Resistance: 24.75/25 Support: 23)

PAX is on the watch list just because the RSI has passed below 30. A bounce from the downward move is imminent due to RSI. There is still no clear reversal from its current downward move, so you must get in and get out immediately. Get in at 23 and sell at 25 for a fast 7% net profit. But you have to be fast for this play. Expect resistance at around 24.75.


PA ( Chart: Daily Resistance: 0.055/0.06 Support: 0.044/0.033)

PA had a remarkable move up with very high volume. This is currently a buy. There is a possibility that this stock may still form a pennant or flag, so buying the dips is also recommended as long as the MACD does not move below signal line. Resistance is expected at 0.06. Looking at the weekly chart (see chart below), this stock seems to be forming a rounding bottom or a cup and handle. Confirmation of this would be if there is high volume when 0.60 is reached.

Monday, February 12, 2007

In Retrospect : AEV, VUL, UPM, PLTL

AEV
I was wrong with AEV with its support line. The stock went to as low as 7.70 before bouncing up. As of now 7.70 looks like a strong support for this stock. Watch out for a move upward towards 9 for this stock

VUL
I was wrong again with the support level for this stock. The stock went as low as 1.44 and a high of 1.54. But the symmetrical triangle is still intact.

UPM
UPM broke resistance, but the volume was not sufficient and the price went back in the triangle. It had a gap down Monday trading and may possibly test support at 0.70

PLTL
Had a valid break out, but the price went back in the ascending triangle. Succeeding days saw sell down of the stock with volume. Expect for prices to still move downward if 6.80 support doesn’t hold

Sunday, December 17, 2006

In Retrospect : BPC, ABS, ABSP, PLTL

BPC

On last analysis, an island reversal formed but this was invalidated by a large volume by Dec 7 which propelled price way beyond resistance and gapped up twice. Price is currently consolidating, probably for another push upward.


ABS/ABSP

The target price of 21 was achieved. Currently consolidating between 22-20 level. There is a good possibility of price to reach 23 and beyond.

PLTL

The ascending triangle was invalidated as price went down to as low as 5.70. It currently was able to break 6.20 with good volume, but the last day of trading it went down and re-tested the 6.20 resistance. Currently a buy recommendation

Sunday, December 03, 2006

StockWatch (Dec 4-8, 2006) BPC, ABS/ABSP, PLTL

BPC (Chart: Daily Resistance: 1.92/1.80 Support: 1.70)

This stock formed an island reversal. Price is bound for another short move upward, but may fail to break the resistance. Recommendation: Sell near resistance

ABS/ABSP (Chart: Daily Resistance: 23 Support: 19/18.50)

ABS/ABSP has formed similar patterns, possibly a falling wedge. The falling wedge may have a target price of 21. But this is not the only important thing to note for this stock. The formation of a falling wedge is a good sign that the price movement is taking a breather from the move up. Which means price can move higher than the target price at 21. Hopefully, a good support will be formed in the price level of 18.50-19 Thing to watch out for is for the bulls to break the resistance at 23. If it is not broken, the sideward movement may take over the bullish sentiment. Another thing to watch is the support at 65 day MA(red line), if this is broken, the falling wedge may be invalidated and this may be a sign of further bearish events to come. Recommendation: Buy if support holds

PLTL ( Chart: Daily Resistance: 6.20/6.10 Support: 5.90)

PLTL seems to be forming an ascending triangle, but a couple of blocking factor may deter the formation to be validated. The last day of trading brought the price back up to the resistance at 6.10, but the volume is not significant. The 2 day downward movement has more significance as it was accompanied by significant volume. At current, the near by resistance at 6.10 needs to be broken and close the gap. But current MACD might be an indication that this may not materialize. Recommendation: Sell for the moment. Wait for further movement before buying.

Sunday, October 29, 2006

StockWatch (Oct 30-Nov 3, 2006) MERB, PCOR, PLTL, PX


MERB (Chart: Daily Resistance: 33 Support: 30 )

The stock is forming an ascending triangle with resistance at 33 and a possible upside of P5. But currently it is also trading within an upward channel. At this point, the ascending triangle is still in its early formation and the volume is not yet confirming the formation. If the ascending triangle is invalidated, we may just see a continuation of the upward channel with resistance at 34.


PCOR (Chart: Daily Resistance: 4.20 Support: 4.10)

PCOR has already broken out of the symmetrical triangle, the breakout volume was sufficient enough but not convincing, and the 260-day MA is currently blocking the price from going up. PCOR needs a little more push. Hopefully more volume would kick in the following days and that the support would hold.


PLTL

Previously I was expecting this stock to go down anytime, but it looks like traders are bullish with this stock and kept on buying it up to 5.30. As of current, MACD has turned from bad to good. Maybe we could expect more from this stock, but we don’t know up until when this upward trend will last. Better keep an eye on the MACD.


PX( Chart: Daily Resistance: 3.95/4.0 Support: 3.70/3.40)

The small ascending triangle previously noted is still intact. Hopefully the support holds

Sunday, October 22, 2006

StockWatch (Oct 23-26, 2006) PSEi, PCOR, FLI, PLTL, PX, AT

PSEi

It is just interesting to note that as of last Friday, the PSEi has already gone past the previous high since last May’s Bull Run. Some stocks are also exhibiting signs of reaching their previous highs last May.


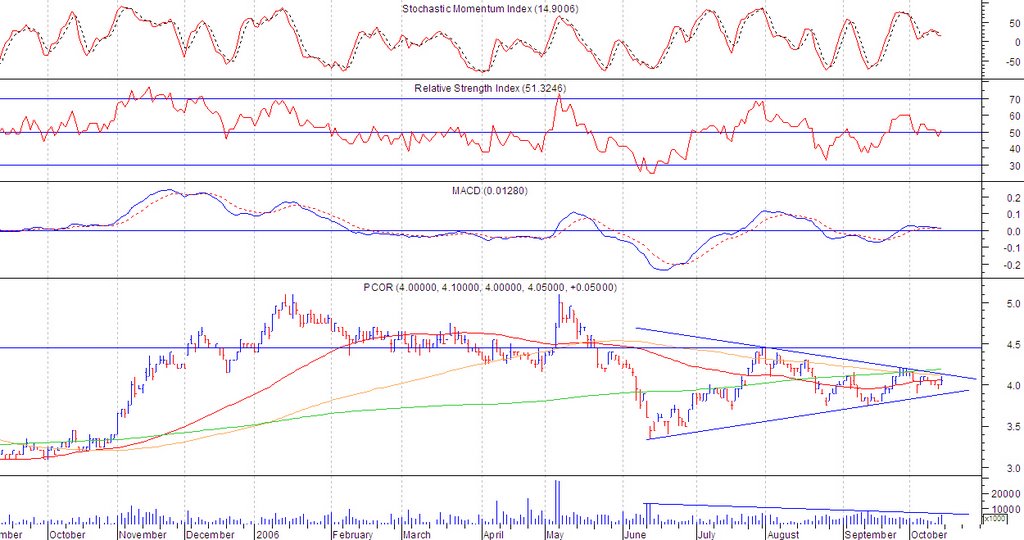
PCOR(Chart: Daily Resistance: 4.10 Support: 3.90)

The symmetrical triangle is still intact. Price is now nearing resistance and currently the 65 day MA is providing support. Again, hopefully the pattern stays intact within the week and the price breaks the resistance. Otherwise if the consolidation is prolonged, the pattern may be invalidated


FLI ( Chart: Daily Resistance: 1.70 Support: 1.60)

FLI is forming a small ascending triangle. Though the possible upside from the pattern is small (just 0.10), it may be an indication that it might be able to reach the previous high of 1.90 last May


PLTL (Chart: Daily Resistance: 5.00 Support: 4.80)

PLTL’s previous rising wedge pattern has been invalidated by the new highs last Monday and Tuesday. From a rising wedge, it has now transformed into an upward channel. But, even if it has changed pattern, the MACD is still in a bearish stance and the higher highs generated by the previous trading days has created a confirmation of the divergence of price from the RSI and MACD


PX( Chart: Daily Resistance: 3.95/4.0 Support: 3.40)

PX seems to be forming a big symmetrical triangle or just an upward channel. From within that big pattern, you can also see a small ascending triangle extending from Sept to Oct with resistance at 3.95. If the small ascending triangle is broken with volume, probably above 15M shares traded, it would have an upside target of 4.75.


AT (Chart: Daily Resistance: 8.50 Support: 8.20)

AT’s falling wedge has been broken in the last 2 days trading of the previous week. The volume on the breakout point is significant, but I think it is lacking. I was looking forward to a volume of above 3M shares traded for the break out point, but it did not materialize. The lacking volume on the breakout point was further confirmed by a low volume on the next trading day. From 2M, volume went down to 200T shares. With this kind of lethargic volume, I am inclined to think that the current price may test the support. Hopefully, if the support is tested and the price succeeds to remain above support and MA line, volume would come in to propel the price to the 9.50 possible target. As of current, I don’t think that would be achieved if the volume does not pickup.

Sunday, October 15, 2006

StockWatch (Oct 16-20, 2006) PCOR, PLTL, AT


PCOR (Chart: Daily Resistance: 4.10 Support: 3.90)

PCOR’s symmetrical triangle formation is still intact. If the resistance is broken, we can expect a target price of 5.10, which is also the previous high last May. But since this is a symmetrical triangle, there is also a possibility of break down. Cut loss immediately if 3.90 is broken.


PLTL (Chart: Daily Resistance: 4.90 Support: 4.60)

Looks like PLTL is showing some bearish characteristics and may indicate that the upward trend may be nearing its end. First obvious sign is the rising wedge. A rising wedge is generally a bearish pattern, and if found at an upward trend, indicates the upward trend to be nearing its end. Second sign is the MACD crossing below signal line. Take profit on rally.


AT (Chart: Daily Resistance: 7.90 Support: 7.70/7.60/7.50)

AT is currently re-testing the support line from June 2005. This stock has previously broken that support line but was able to recover during the middle of June 2006. But before the 2005 support line is challenged, it has to challenge a couple of support levels: the 130 day MA and the support line from a big triangle (green), both converging at the 7.70 price level. Im guessing (just a guess) that price may move further down to 7.60, the 2005 support line. What I am hopeful about is the currently forming falling wedge, which if the price breaks out from, may see a potential upward movement to 9.50.

Sunday, September 10, 2006

StockWatch (Sept 11-15, 2006) SMPH, PCOR, PLTL, MBT, ALI


SMPH
Price is still within the ascending triangle. Hopefully the support at 7.70 holds to keep the ascending triangle intact.


PCOR

I earlier said that PCOR is an ascending triangle. On further analysis, I was wrong in assuming that it is an ascending triangle. After this week’s activity, it seems to be forming more as a symmetrical triangle, with support at 3.8 and resistance at 40.50. Considering the volume increase towards the tip of the triangle, I’m now in doubt if this is a valid symmetrical triangle. I am more inclined to consider this as a bearish move that may break the support.


PLTL

PLTL has broken out of the symmetrical triangle, but has yet to meet its target price of 4.75 because it has met a resistance at the 4.35 level. From the 4.35 level it moved back 38.2%. If the price is able to hold at the 4.10 level, we may still see a further upward move to its target price of 4.75. If not, we may see a move towards the 3.8 level the previous resistance which is now a support level


MBT

I was expecting a breakout of price from the ascending triangle formation, but apparently, the break above the 39 level resistance came without a convincing volume. The succeeding days further confirmed the false breakout. It now seems to be further consolidating into an upward channel. The immediate support is at 39 and resistance is at 40.50.


ALI

The recent price movement of ALI seems to confirm the resistance at 14.25. But after further analyzing, there are several patterns that seem to be forming. There are 2 ascending triangle forming. The first is a big ascending triangle with a target at around 17 and the second is a small ascending triangle, with a target at around 16. The third is a sideward channel. But I think the smaller ascending triangle and the horizontal channel are much more valid than the bigger ascending triangle. If the resistance is broken without volume, im expecting a slow push towards the 15 level. If it does reach that level, we may be looking at a big ascending triangle.