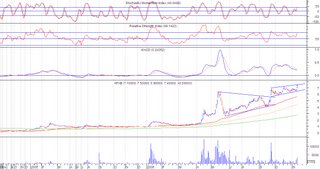
PSEi (Chart :Daily Resistance: 3485 Support: 3402)
The resistance line that was broken last week provided support for the index and enabled it to move sideways. For the coming week, I am more inclined to say that the index might not be able to move upward for the mean time as trading last Friday moved the index higher but closed lower and formed a black candle accompanied by high value turnover. Expect further sideways movement for this coming week. The resistance line turned support is something to observe for the coming week. If it is able to provide support for the index, this might be a sign that the index will move higher and it is just consolidating above the support line.
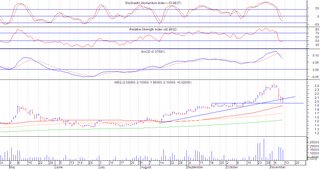
JGS (Chart: Daily Resistance: 17.50 Support: 16.25)
JGS is still a viable option to rake in some money. JGS made a return move towards support at 16.25 and never went below the support line. While on the return move to support, the volume was not large enough to cause problems, instead it just gave opportunity to accumulate more JGS at a lower price. Trading last Friday created a white candle accompanied by large volume and is definitely a very visible sign that the index is now on its way up towards the target price of 19.
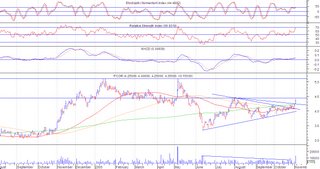
RCB (Chart: Daily Resistance: 25 Support: 21)
The stock brokeout from an ascending triangle with large volume. Target price is at 25, but the recent breakout diminished the returns. Watch out for a return move towards support, if this happens and support holds, then this is an opportunity to buy more of the stock
Search Google
Sunday, July 25, 2010
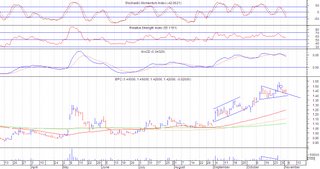
StockWatch (Jul 26-30, 2010): PSEi, JGS, PNB, RCB
Posted by
Mikes
at
11:01 PM
0
comments
Labels: JGS, PNB, PSEi, RCB, StockWatch
Sunday, July 18, 2010
StockWatch (Jul 19 – 23, 2010): PSEi, JGS
PSEi (Chart: Daily Resistance: 3485 Support: 3289)
The index made an unexpected move upwards beyond the usually strong resistance level. This is a very significant event, as the resistance line usually held its position, this means the bulls are slowly winning against bears. This might be an indication of good things to come, but as of current, the index would have to move downward for now as the index is overbought. Observe the 65 day MA as this may provide support for the index.
Posted by
Mikes
at
11:52 PM
0
comments
Sunday, February 08, 2009
StockWatch (Feb 09-13, 2009): PSEi, MWC, JGS, BPI
PSEi (Chart: Daily Resistance: 2004/2068/2200 Support: 1818)
The index made an unexpected rally on the last 2 days of trading last week. The index had a white candle with a very small wicker accompanied with large volume. This suggests strength possibly for the short term only. Another remarkable action last week, is that the index is now above the 65 day MA. Judging from the RSI and the stochastics, there is still a little bit room for upward movement before the rally gets capped. Hopefully, the large volume last week could sustain further upward movement this week. The rally was definitely a welcome sight for the index as it prevented the index from forming lower lows.
Watchout for resistance at 2004/2068, these are previous high on the chart, while 2200 is the 130day MA level. It is highly possible that after the rally, there will once again be a short sideward movement before it moves down, which has been the pattern since November 2008. Once the index starts to move sideways again, this would be the best time to cash in on your gains.
There is still no reversal pattern seen in the charts and it looks like the index will continue to move within a range.
MWC(Chart: Daily Resistance: 12.50/12.75 Support: 11.00/9.50)I was wrong in assuming that this would be a fast trade. As it turned out, it took more than a week before the rally last Jan 23 continued. This got me worried a bit, but the low volume on the days where the stock went down provided some consolation that the selling action is week and that there is still a possibility of a continuation of the rally. From last week’s trade, patience paid off when the stock continued its rally towards 12.50. It seems to be a result of a breakout of a small symmetrical triangle, or if you would consider, a pennant formation with the pole from Jan 23. Both of the pattern’s target price is already reached and it also has touched resistance at 12.50. There may still be room for a little more upward movement as the RSI and stochastics seems to suggest. But I would rather sell for now and observe how the stock would play for the following days. A gap and breakdown with large volume last Jan 16 isn’t easy to ignore. I believe that it would take more than the volume from last week’s rally for the stock to be able to move past the gap, so volume is an important indicator of where the stock would go. If by next week volume doesn’t pick-up, the rally/re-test of previous support-turned-resistance line would fail to move further upward.
BPI (Chart: Daily Resistance: 38 Support: 33.50)BPI had some promising move last week. Trading last Friday closed the gap that was formed last Jan 29 with volume and also forming a gap-up. This gap up gave way to the formation of an island reversal from the recent downward movement since the start of 2009. However, there is an upcoming resistance at 38, which is the 65 day MA, so volume needs to pickup for next week for it to be able to sucessfully move past the resistance.
Posted by
Mikes
at
8:26 PM
0
comments
Labels: BPI, JGS, MWC, PSEi, StockWatch
Sunday, November 09, 2008
StockWatch (Nov 10-14, 2008): PSEi, JGS, BPC
PSEi (Chart: Daily Resistance: 2070 Support: 1850/1680)
The index continued its rally Monday last week only to be stopped by the support-turned-resistance line near 2030. Looks like this rally is just a short return move to re-test the resistance line and unfortunately the resistance line held its ground. For the succeeding trading days, the index went down and even creating an island reversal.
Aside from the island reversal, we can see that last Friday’s trading created a short white candle. But unfortunately again, the volume was not that significant. With this, it is highly probable that the index will continue to move further down and may probably close the gap that was created by the rally 2 weeks ago.
Still there is no major sign of a reversal from the current bearish conditions. The MACD, even though it has crossed above the signal line, is still in bearish territory. In a bearish market, the RSI at 50 level is usually a resistance area, which for last week has proven such.
For the coming week watch out for the following: a.) If support at 1850 holds, then this is a very good indication of good things to come as a higher low might be formed if the support holds. b.) Otherwise if the index still moves past 1850, then there is a possibility for a double bottom formation if support at 1680 holds. If this materializes, this might be the reversal sign that we are hoping. c.) If the index still moves past the previous low, then were headed for more selling action.
BPC (Chart: Daily Resistance: 1.70 Support: 0.96)
Posted by
Mikes
at
5:37 PM
0
comments
Labels: BPC, JGS, PSEi, StockWatch
Sunday, November 12, 2006
StockWatch (Nov 13-17, 2006) Mining Index, LCB, APXB, PX, MEG, JGS
Just something to note: The mining index registered an unusual increase in volume last Friday. The index gapped up with high volume, which indicates that traders have started coming in. We may see mining stocks having their day in this bullish market.
LCB picked up in volume lately. No pattern has emerged, except for an upward channel. But with the pickup in volume, and the mining index picking up, we could hope that LCB would ride with the wave towards the long term resistance at 0.45 level.
APXB ( Chart: Daily Resistance: 7.50 Support: 6.50)Interesting to note: APXB gapped up with volume. High possibility of upward movement to break the resistance as MACD positioning to cross above the signal line. Although RSI might be oversold, seeing previous RSI levels may indicate that a move beyond the oversold level is a possibility. Hopefully APXB (and APX) could also ride the mining wave.
PX ( Chart: Daily Resistance: 5.00/5.50 Support: 4.30/4.00)Interesting to note: PX gapped up and broke out from a short term resistance line of 4.30. The increase in volume hopefully would bring the price up to its previous high of 5.90
MEG( Chart: Daily Resistance: 2.44 Support: 1.96)MEG has had a bearish move recently. MACD crossed below the signal line accompanied with volume. No pattern has emerged yet, but what MEG needs is additional volume in its upward move for it to reach the previous high. If more volume does not come in, we could see a side to downward move. For now, a bounce from the support might be forthcoming.

JGS ( Chart : Daily Resistance: 8.10 Support: 7.90/7.40)
JGS has formed a rounding bottom pattern, with the characteristics of high volume activity on the sides of the pattern. But recent price movements have somehow started to invalidate the pattern as no high volume came to break the resistance and the price continued its sideward movement. RSI is currently oversold and MACD has crossed below signal line, which might indicate an up coming move downwards. For now it would be best to take profit and possibly pick it up later.
Posted by
Mikes
at
11:26 PM
0
comments
Labels: APXB, JGS, LCB, MEG, Mining Index, PX, StockWatch
Sunday, November 05, 2006
StockWatch (Nov 6-10, 2006) SMPH, JGS, PCOR, BPC
SMPH
SMPH reached its ascending triangle target of 9.50.
JGS (Chart: Daily Resistance: 8.10 Support: 7.90-7.40)
JGS has reached last May’s previous high of 8.10 and it is now testing that resistance. It is a wait and see if the resistance will be broken by the bulls. If it is broken with volume, we may see a move towards P9-10 level. A short term down movement may happen as the stock is on the oversold level and MACD is positioning to cross down the signal line.
PCOR (Chart: Daily Resistance: 4.45 Support: 4.20)
The support held after the breakout and last Friday we saw the volume pick up to 13M shares traded. The price also went above the 260 day MA. Previous high last July is now the current resistance at 4.45. Target price for this breakout is 5.10
BPC (Chart: Daily Resistance: 1.46/1.54 Support: 1.42)
After breaking out of a small symmetrical triangle, it has started to retest the previous resistance line, which is now the support. A gap down can be noticed 2 days after the break out. If the support holds, we may see a move back up to 1.54. If the support is broken, next level of support is 1.38. But the high volume at breakout gives a higher possibility that the support would hold and the gap down be covered.
Posted by
Mikes
at
9:04 PM
0
comments
Labels: JGS, SMPH, StockWatch
Monday, July 31, 2006
StockWatch (Jul 31-Aug 4) JGS

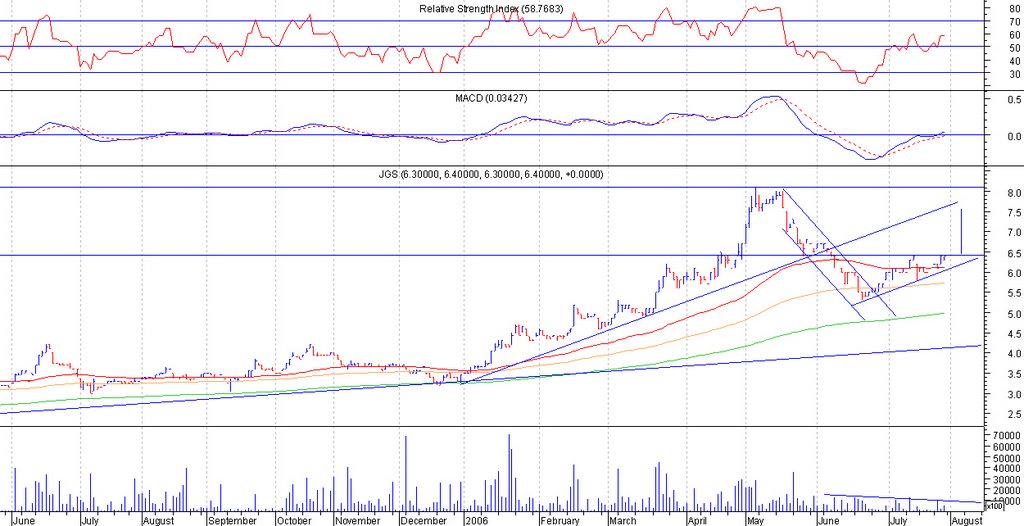
JGS (Chart: Daily ** Resistance 6.40 ** Support : 6.10)
JGS is bullish as price is above 3 MA’s and MACD is starting to move above 0. What I am seeing is an ascending triangle with resistance at 6.40. If it moves to 6.50 with volume, our target will be 7.50. Cut loss at 6.40. I would be waiting for 6.50 with volume confirmation as it may happen that the price would just consolidate and move sideways.
Posted by
Mikes
at
8:43 PM
0
comments
Labels: JGS
Saturday, March 25, 2006
Inretrospect (Mar 19-24 2006) JGS, SMPH, MWC
JGS
Whoa!!! And the ball is out of this field!!! This stock turned mad bull and charged its way up unceasingly. In my last week’s analysis, the target price that I set was at 6.10, and last Friday it did reach our target price. Lucky are those who were able to ride the bull. Mang libre naman kayo! =p. You’d ask when would the upward movement end? Well ofcourse no one knows! Just practice your discipline and get out of that stock, coz it has already reached its target price. It may still kick up some fluctuations by Monday, but I wouldn’t bet a 100% on that as RSI is nearing oversold level. The stock is good for long hold, but ofcourse being a tsupitero, it is best to sell now, then buy later at a lower price when the price of the stock pulls back, then hold it if your really going for long.
SMPH
In my analysis last week, I’ve said that this week would be SMPH’s week, but I guess I was expecting a lot from this stock. I was expecting it to fly, but it did not, what happened was there was a lot of accumulation at 7.90. and it has for the whole week, tried to cross below the 65 day MA. MACD is now positioning itself to cross down, and its weekly and monthly MACD does not confirm a bullish trend that I was expecting. Looks like 8.0 has proven itself to be a strong resistance while 7.90 looks also like a strong support. Will it go down? Im not sure, but if next week is still characterized by accumulation at 7.90 level, we may still have a chance of breaking the 8.0 –8.10 level. If the support at 7.80 – 7.90 does not hold, we could expect price move down to 7.60
MWC
Nothing new here, as from my previous analysis, I was expecting accumulation at 6.40 and there was accumulation at that level. The only thing new was the 130-day MA catching up with the 6.40 support. MACD has now crossed below signal line, sign of things to come? My bet is that it would still be able to maintain the 6.40 support
Posted by
Mikes
at
3:10 PM
0
comments