Forgot to post my analysis last monday, but just for historical purposes and to validate my analysis I will still be publishing my delayed analysis :D
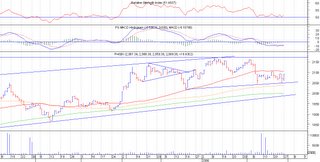 PHISIX (Chart:Daily ** Resistance:2100 ** Support:2050)
As expected, last Friday’s turmoil painted the index red, but a surprising move happened on Monday. Just as I was expecting that the index would again plunge due to the Marines standoff last Sunday and the standing state of emergency, the index instead shined this Monday and closed near Thursday’s closing price. The index is currently moving sideways with a slight upward. What is very prominent is that the index is trapped in between the 65 and 130 day MA. It’s anyone’s guess as to when it would break out from the 2 MA’s. An event to look forward to is the upward crossing of MACD from below the signal line. But even if it crossed the signal line, it still might not be enough for the index to cross above the 65 day MA.

GLO (Chart:Daily ** Resistance:855 ** Suport:820)
In my last analysis, I expected GLO to pull down to 780-800 level. I guess I overshot my analysis. The stock pulled down reaching the 805 level and has continued to move upwards. Some of you may have noticed that there seemed to be a small pennant that formed in the succeeding days after the breakout. The pennant formation broke out last Thursday, but due to the turmoil last Friday, it started to dip, but was able to recover as of Monday. It is currently testing the support level, if it proves to be strong, we might still be able to see the realization of the pennant’s break out for the price to reach 880-890 levels.

PAX (Chart:Daily ** Resistance:7.80/8.00 ** Support:7.10/6.90)
It seems that this stock is trying to form an ascending triangle. But a couple of not so good things can be seen in the chart. First is the MACD opening wider and moving downwards. Second is the divergence of price from the RSI and MACD. Lets give this stock 1 more week and then we’ll check where it has gone. But as for now, my bet is that it would try to break the support at 7.10 and may still reach the 65 day MA.
 PCOR (Chart:Daily ** Resistance:4.60 ** Support: 4.40 )
The 65-day MA, which proved to be a strong support for the past days, has been broken last Friday. Price is now below the 65-day MA, I expect price to move sideways in the coming days. One thing that I overlooked in my last analysis is the divergence of the price movement from the RSI and MACD values. If the resistance proves to be strong we could expect price to either move sideways or downwards. My bet is that prices will move down near the 4.0 price level due to the divergence.
 JFC(Chart: Daily ** Resistance: 36-38 ** Support: 33)
260 day MA has provided strong support even during last Friday’s turmoil. I still expect prices to consolidate in between 260 and 130 day MA. In the mean time well focus on other stocks.

MBT (Chart:Daily ** Resistance: 34 ** Support: 32)
Looks like this stock is now poised for break out in the coming days. Buy at 34.50-35 if it breaks out; sell if it moves down to 33.50.
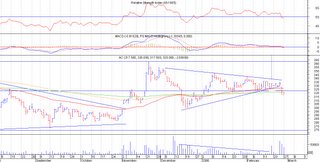
AC (Chart: Daily ** Resistance: 320 ** Support: 312)
Surprising move by AC, it formed a symmetrical triangle. As with any symmetrical triangle, it could either break up or down. I was bullish on this stock that I was expecting a break out, but last Friday’s turmoil sealed the triangle’s fate as it broke down from the pattern. Currently 260 day MA is acting as a resistance. We expect price to move downwards to 300 and there is still a possibility of reaching 275-290 price level


 -There's a new forum in the block and it's named TraderCentral.ph. As the name implies, this forum is a convergence site for traders. Expect discussions about a stock from a technical analyst's point of view. There are also topics on TALK (Technical Analysis Learning and Knowledge base) and if your still trying to grasp the TA chit-chats in this forum, you can post a question in the TALK area and some of the members will ofcourse gladly help you out. This forum is just in its infancy stage, but given some time, this will definitely grow in to a big community.
  -There's a new forum in the block and it's named TraderCentral.ph. As the name implies, this forum is a convergence site for traders. Expect discussions about a stock from a technical analyst's point of view. There are also topics on TALK (Technical Analysis Learning and Knowledge base) and if your still trying to grasp the TA chit-chats in this forum, you can post a question in the TALK area and some of the members will ofcourse gladly help you out. This forum is just in its infancy stage, but given some time, this will definitely grow in to a big community.
 PHISIX (Chart:Daily ** Resistance:2100 ** Support:2050)

 PCOR (Chart:Daily ** Resistance:4.60 ** Support: 4.40 )
  JFC(Chart: Daily ** Resistance: 36-38 ** Support: 33)