

Search Google

Custom Search
Tuesday, September 05, 2006
Steve Irwin passed away Sept 4, 2006

StockWatch (Sept 4-8, 2006) PCOR, ALI, GLO, SMPH

PCOR (Chart: Daily ** Resistance: 4.20/4.45 ** Support: 3.8)
PCOR seems to be forming an ascending triangle. The target for the formation is 5.50. Breakout price is at 4.50. The 3 MA’s is currently blocking the price movement, but this might be broken within the week for the price to reach the resistance at 4.45.
ALI (Chart: Daily ** Resistance: 14.25/15 ** Support: 13.50)
ALI is forming an ascending triangle with resistance at 14.25. If the resistance is broken with volume expect a target of 17.75. But before it reaches that target it also has to break the previous high of 15. If the price continues to move up with low volume, we could redraw the resistance at 15 and expect a higher target price. But for now, we just would have to wait.

GLO (Chart: Daily ** Resistance: 1080 ** Support: 980)
GLO is trading in an upward channel. There is also a symmetrical triangle formation but the volume does not confirm the pattern, so its more likely to be an upward channel. I included GLO in the list because I noticed that volume is slowly picking up. There might be something brewing in this stock.
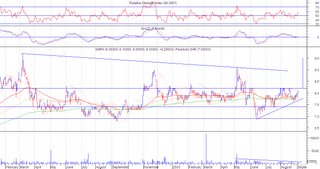
SMPH (Chart : Daily ** Resistance: 8.20 ** Support: 7.70)
SMPH is forming an ascending triangle with resistance at 8.20. Possible upside target of 9.50. But before it reaches the target, resistance might be encountered at th 8.50 and 9 level.
Monday, September 04, 2006
Pluto got booted out of the Solar System society of planets
I was too busy with work that I haven't been reading the news lately. I got the shock of a lifetime when I heard from Jay Leno that Pluto just got booted out of the elite planet society of the Solar system. I thought at first, Jay Leno was just kidding, but as I searched the internet, it turns out that it was true. (http://www.cnn.com/2006/TECH/space/08/24/pluto.ap/index.html).
Just my thought, this latest demotion of Pluto to a dwarf planet just added Pluto to the top of the list of other possible attackers of Earth. (Forget about the Marsians, they don't have a grudge against Earthlings, they just want to conquer the planet. ) The dawn of the Macross days is near! hehehehehe!
Monday, July 31, 2006
StockWatch (Jul 31-Aug 4) JGS
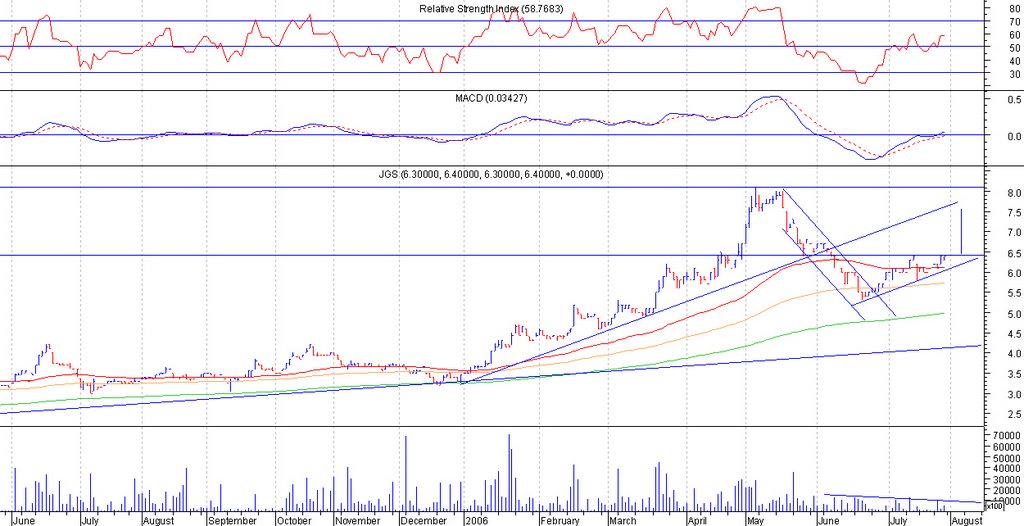
JGS (Chart: Daily ** Resistance 6.40 ** Support : 6.10)
JGS is bullish as price is above 3 MA’s and MACD is starting to move above 0. What I am seeing is an ascending triangle with resistance at 6.40. If it moves to 6.50 with volume, our target will be 7.50. Cut loss at 6.40. I would be waiting for 6.50 with volume confirmation as it may happen that the price would just consolidate and move sideways.
Monday, July 17, 2006
StockWatch (July 17-21, 2006) ALI, BPI, LCB
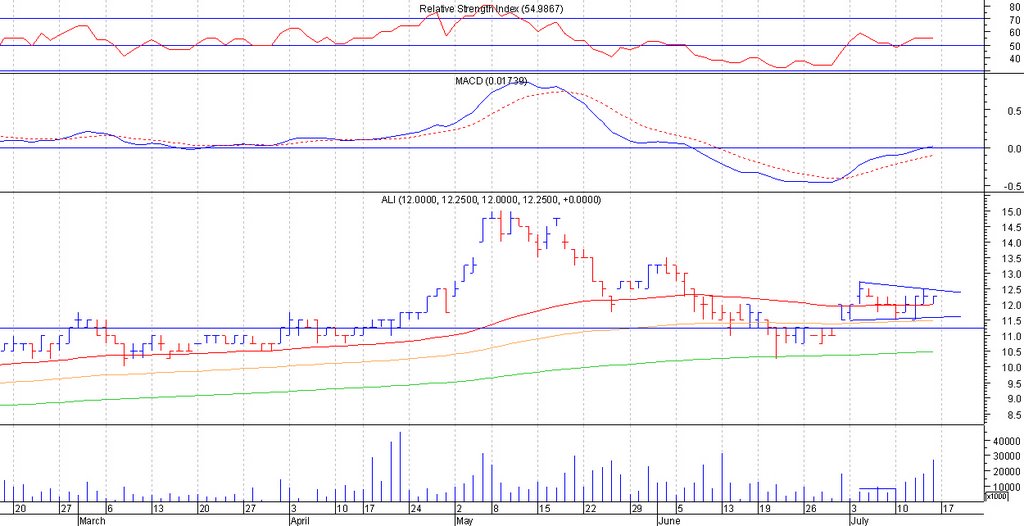
ALI (Chart : Daily ** Resistance: 12.50 ** Support: 11.75-12)
ALI is trading in a symmetrical triangle, but there is no diminishing volume. What I actually noticed is the increasing volume in the last 4 trading days. The increase in volume seems to have given a strong support at the 12 price level. If the increase in volume continues, supply at 12 level may be exhausted and we might see an upward price movement up to 13 level, the immediate previous high.
BPI(Chart: Daily ** Resistance: 51** Support: 49)
If my eyes aren’t fooling me, Im actually seeing either a symmetrical triangle or an inverse H&S forming. Both patterns share the same resistance line at 51. On the conservative side, if it is really a symmetrical triangle, we can have a target price of 56. If it is really an inverse H&S we can have a target price of 62. But ofcourse we should still be on the lookout for resistance at 55 and 60 level. Get in at 51, cut loss at 50. 
LCB ( Chart: Daily ** Resistance: 0.35 ** Support: 0.32 )
LCB is forming an ascending triangle, with resistance at 0.35. Target price is 0.40. I am not just sure if the price would be able to successfully move above the 65 day EMA as price has been bouncing off the 65 day and 130 day EMA
Subscribe to:
Posts (Atom)




