Search Google

Custom Search

Sunday, October 15, 2006

StockWatch (Oct 16-20, 2006) PCOR, PLTL, AT


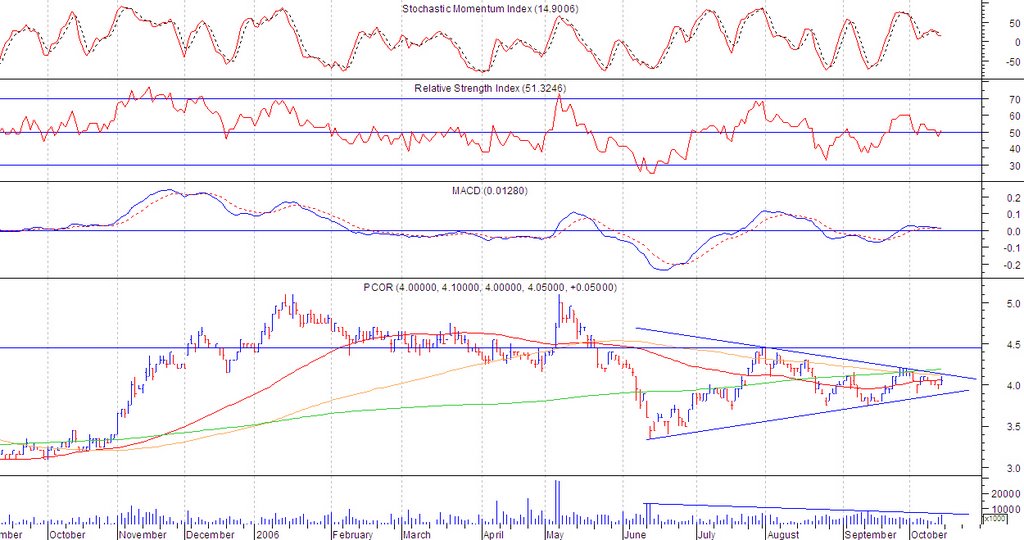
PCOR (Chart: Daily Resistance: 4.10 Support: 3.90)

PCOR’s symmetrical triangle formation is still intact. If the resistance is broken, we can expect a target price of 5.10, which is also the previous high last May. But since this is a symmetrical triangle, there is also a possibility of break down. Cut loss immediately if 3.90 is broken.


PLTL (Chart: Daily Resistance: 4.90 Support: 4.60)

Looks like PLTL is showing some bearish characteristics and may indicate that the upward trend may be nearing its end. First obvious sign is the rising wedge. A rising wedge is generally a bearish pattern, and if found at an upward trend, indicates the upward trend to be nearing its end. Second sign is the MACD crossing below signal line. Take profit on rally.
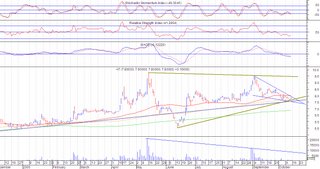

AT (Chart: Daily Resistance: 7.90 Support: 7.70/7.60/7.50)

AT is currently re-testing the support line from June 2005. This stock has previously broken that support line but was able to recover during the middle of June 2006. But before the 2005 support line is challenged, it has to challenge a couple of support levels: the 130 day MA and the support line from a big triangle (green), both converging at the 7.70 price level. Im guessing (just a guess) that price may move further down to 7.60, the 2005 support line. What I am hopeful about is the currently forming falling wedge, which if the price breaks out from, may see a potential upward movement to 9.50.

Monday, October 09, 2006

Stock Watch (Oct 9-13, 2006) PCOR

PCOR (Chart: Daily Resistance: 4.16 Support: 3.85)

PCOR is forming a symmetrical triangle. I earlier commented that this stock has a negative outlook as the sell down from Sept 5-14 was accompanied by substantial volume, the MACD was below zero line and signal line. But currently, volume is also substantial in the upward movement and the MACD has crossed above zero line which now implies a positive outlook. The recent increase in trading volume suggests that this stock has caught the attention of some traders. If resistance is broken with volume, a possibility of near 1 peso increase in price.

Monday, September 25, 2006

StockWatch(Sept 25-26, 2006) PHISIX, PCP, APXB


PHISIX
Currently within a pennant formation, if the pennant is broken , upside is 2700


PCP

PCP is in a pennant formation. Resistance is at 0.17, support is at 0.15. Target price is 0.23. Sell immediately if it goes below support.


APXB

Already broke out of triangle. Waiting for a pullback at around 6 to get in

Saturday, September 16, 2006

StockWatch (Sept 18-22,2006) ALI, SMPH, MAB

MAB

A possible symmetrical triangle is emerging from MAB. But at this point, im not so sure if the volume confirms it.


SMPH

The ascending triangle is still intact with resistance at 8.20. Im expecting that this may reach 8.10-8.20 before pulling back to near support of 7.80-7.90


ALI

The ascending triangle is still intact. If it is still unable to break resistance at 14.25, this would be a confirmation that it is now on a sideways movement with a range of 13 -14.25

Sunday, September 10, 2006

StockWatch (Sept 11-15, 2006) SMPH, PCOR, PLTL, MBT, ALI


SMPH
Price is still within the ascending triangle. Hopefully the support at 7.70 holds to keep the ascending triangle intact.


PCOR

I earlier said that PCOR is an ascending triangle. On further analysis, I was wrong in assuming that it is an ascending triangle. After this week’s activity, it seems to be forming more as a symmetrical triangle, with support at 3.8 and resistance at 40.50. Considering the volume increase towards the tip of the triangle, I’m now in doubt if this is a valid symmetrical triangle. I am more inclined to consider this as a bearish move that may break the support.


PLTL

PLTL has broken out of the symmetrical triangle, but has yet to meet its target price of 4.75 because it has met a resistance at the 4.35 level. From the 4.35 level it moved back 38.2%. If the price is able to hold at the 4.10 level, we may still see a further upward move to its target price of 4.75. If not, we may see a move towards the 3.8 level the previous resistance which is now a support level


MBT

I was expecting a breakout of price from the ascending triangle formation, but apparently, the break above the 39 level resistance came without a convincing volume. The succeeding days further confirmed the false breakout. It now seems to be further consolidating into an upward channel. The immediate support is at 39 and resistance is at 40.50.


ALI

The recent price movement of ALI seems to confirm the resistance at 14.25. But after further analyzing, there are several patterns that seem to be forming. There are 2 ascending triangle forming. The first is a big ascending triangle with a target at around 17 and the second is a small ascending triangle, with a target at around 16. The third is a sideward channel. But I think the smaller ascending triangle and the horizontal channel are much more valid than the bigger ascending triangle. If the resistance is broken without volume, im expecting a slow push towards the 15 level. If it does reach that level, we may be looking at a big ascending triangle.